


2026 Investment Outlook: Getting Hot
Thu, 01/29/2026 - 08:00 Wealth management

by John M. Fidler
Chief Investment Officer | (502) 259-2543 | John.Fidler@syb.com
2025 Year-in-Review: A Long Strange Trip
2025 was a great year for investors as nearly every asset class generated solid returns. Interestingly, despite all the hype around the “Magnificent 7” stocks, only two of those seven stocks ended the year ahead of the S&P 500. Notably, developed International stocks outperformed US stocks by the widest margin since 1993.
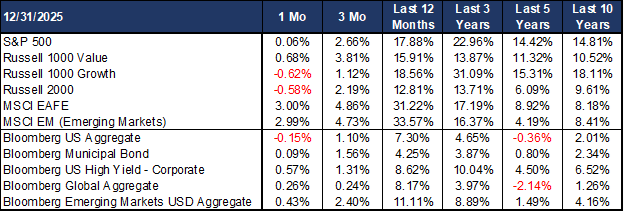
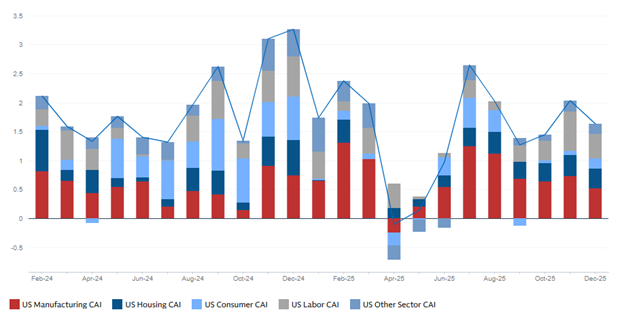
While full-year market returns (and the lack of red ink in the table above) do not reflect it, the US economy saw a major demand shock from slower government spending growth, a sharp decline in immigration, and $400B tariff run-rate (remember, tariffs act like a tax increase). This slowed the economy markedly in mid-2025, evidenced by the Current Activity Indicator below (a measure of coincident economic growth). We do not anticipate these factors repeating in 2026.
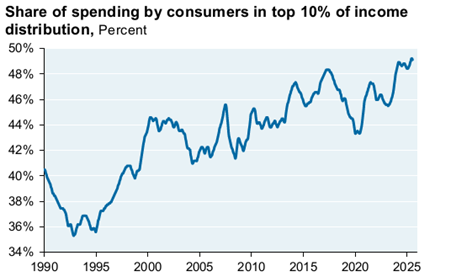
The resulting Liberation Day market panic over-discounted these risks, and a relentless stock market rally followed. Supporting this recovery was a self-reinforcing wealth effect that kept consumer spending robust. However, consumer strength has not been broad-based, with an increasing share of spend driven by the wealthiest consumers.
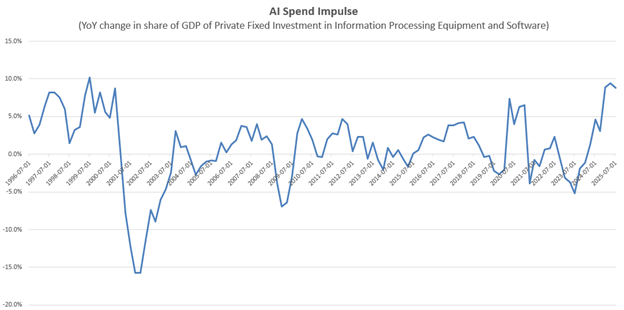
Importantly, while artificial intelligence (AI) has been the major driver of US stock returns since the launch of ChatGPT in late 2022, 2025 was the year that this technology platform shift meaningfully impacted the “real” economy. AI capital expenditures (capex) grew as a share of the economy markedly in 2025, rising to 1.4% of GDP versus 0.5% in 2019, and that should continue into 2026, with hyperscaler capex representing close to 2% of GDP.
Inflation remained sticky and well above the Federal Reserve’s 2% target, but stable.
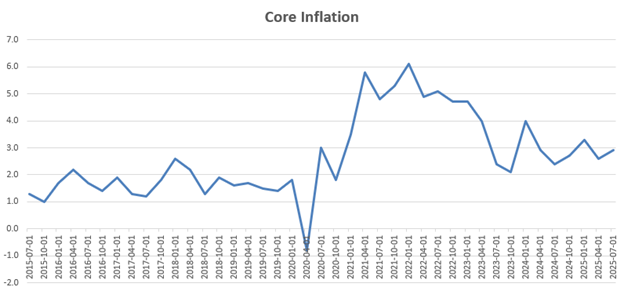
While growth was strong in 2H25, and appears to be accelerating into 2026, the labor market weakened meaningfully.
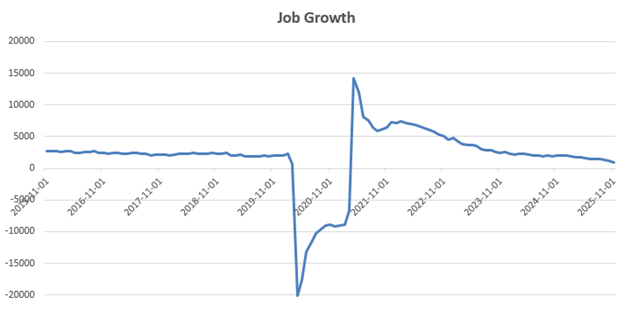
The dichotomies evident in a strong economy (but a weak labor market) driven by AI spending (by only the very largest companies) and consumer spending (by only the richest people) are something we discussed in our last note in 4Q. We note that these factors should support additional Fed easing in 2026, although early evidence in 2026 does show some modest improvement in labor market dynamics.
2026 Outlook: Too Much of Everything is Just Enough
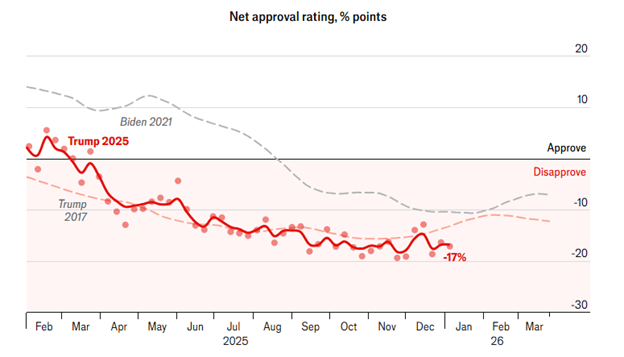
We enter 2026 amidst a continued healthy economic backdrop. Currently, we are seeing a re-acceleration in the US, driven by a consumer wealth effect and AI capex. The widespread consensus is that the current administration wants to “run the economy hot” into the mid-term elections to boost flagging poll numbers (a common trend for first-term Presidents, as the chart below shows – though one could argue that President Trump is a second-term President).
Continued disinflation in shelter, labor, and oil appears likely. Rents continue falling and job creation remains weak. Even if we see a sharp rise in energy prices in 1H26, key consumer items like gasoline will remain cheaper than they were a year prior.
In addition, the economic growth reacceleration led by AI spend continues, supported by the impacts of the OBBB that will boost growth in 1H26 by effectively creating more government deficit stimulus than we saw in 2025. Tariff-related uncertainty is fading, while the fiscal impulse is set to flip from a meaningful drag (-0.6% of GDP in $Q25) to a tailwind (+0.5% to +0.9% of GDP in 2026). The IMF estimates that fiscal policy across the G3 will be strongly expansionary in coming quarters.
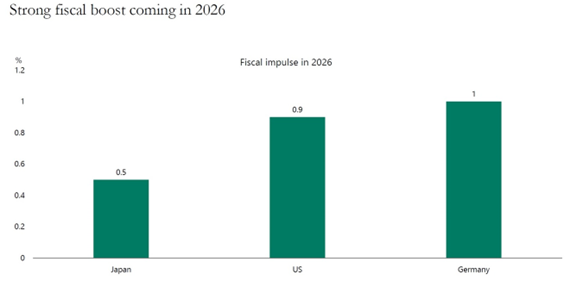
In the US, about half this impact is due to accelerated depreciation encouraging corporate investment. The other half is due to increased tax refunds to consumers (especially households earning under $200k/year). This should keep corporate investment and consumer spending robust, although a weak labor market will continue to exacerbate the “K-shaped” economy discussed previously.
Credit, the lifeblood of the economy, seems to be improving. Defaults are ticking lower and bank lending is picking up.
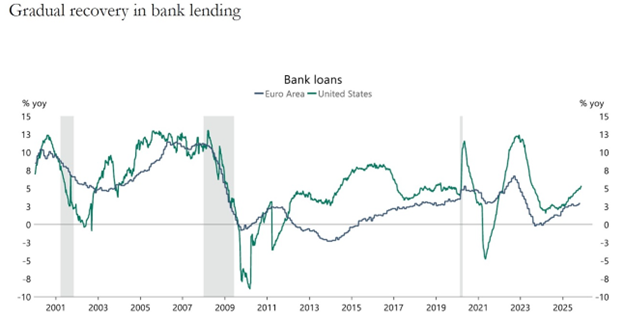
While it seems like we’ve been here before, the backdrop entering 2026 is different from 2025 in a couple of important ways. As mentioned earlier, the productivity drag from increased tariffs and decreased immigration is unlikely to repeat in 2026. Immigration has slowed to a trickle and cannot mathematically fall much further. Tariffs appear to have settled at a well-understood level around 18% (effective tariff rate). This is much higher than where they were a year ago (2%) but far below the highest Liberation Day tariff threats of 30-40% or more. Tariffs could fall, at least temporarily, as a result of the upcoming Supreme Court decision, but they are unlikely to rise from current levels.
Taken altogether, this backdrop makes it difficult to envision a significant economic downturn in 1H26. Our focus is on 2H26, when we expect a very dovish Fed combined with some form of consumer-targeted fiscal stimulus from the Administration to improve mid-term election performance. These factors, on top of already healthy growth, threaten an overheating economy and a resurgence of inflation in 2H26.
Investment Implications: We Can Have High Times (if Inflation Abides)
Following three strong years in a row for equities, there is a natural temptation to believe markets are “due” for a down year. However, just as three reds in a row at the roulette table does not change the odds in favor of black on a fourth spin of the wheel, the 2023-25 pattern does not suggest a down year in 2026. Since 1887, there have been 11 periods of three consecutive positive years for stocks, and in eight out of 11 such periods, the fourth year was positive. Yes, we are aware that 11 data points is not a statistically significant sample size, but nonetheless worth noting. Another fun fact: since 1887, 85% of years ending in “6” were positive. Again, not statistically significant: cocktail party trivia, not investment advice.
On a more serious note, we experienced a technical bear market in April 2025 following Liberation Day. Going back over the 32 bear markets for US stocks since 1900, the 12-18 months post-bear market are historically a good period for stocks, with returns higher and drawdowns lower than normal. We saw this in 2H25 and it bodes well for the market at least into 2Q.
While the last 10 years of equity market performance have provided a tidal wave for investors to surf, there will inevitably be volatility at some point, and we have definitely not seen the last market correction. Our goal to clients is to build portfolios that withstand corrections and then use volatility to our advantage. The traditional “60/40” stock/bond portfolio is not necessarily super-diversified nor super low- risk. Optimal risk management comes from thoughtful portfolio construction ex ante, not stop losses or panic selling ex post. Our goal is to include portfolio diversifiers such as commodities, international stocks and bonds, and alternatives to provide true diversification. When everything looks expensive, diversifying assets like absolute return, hedged trading strategies, as well as real assets play an important role in portfolio construction. We suspect 2026 (like 2025) will provide an excellent buying opportunity for patient investors at some point, and we want to have dry powder in portfolios to take advantage of it.
But to be clear – our view is that the sky is not falling and AI is not a bubble about to burst. Even if one believes that AI is a bubble (and we believe that this is only currently true for certain privately held AI companies, not the public companies we hold broadly in client portfolios), bubbles do not typically burst when central banks are cutting, profits are high, and balance sheets are strong. A wave of AI IPOs, combined with a Fed that is forced to turn more hawkish, could change this narrative later in 2026.
As discussed in prior Outlooks on the AI “bubble,” most mega-cap tech companies are still funding their spending out of cash flow, not debt. As long as the Googles, Microsofts, and Metas of the world are making more money than they invest, we fail to see how the top is in for this cycle of tech investing. As the chart below illustrates, these companies are spending an increasing share of their pre-tax earnings, but we are nowhere near “dotcom” bubble levels from an objective historical perspective.
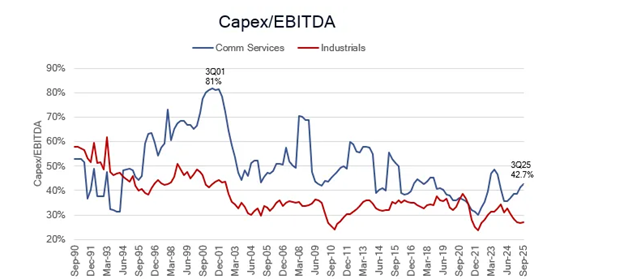
At the same time, the US stocks at the lowest earnings yield since 2000, markets are clearly pricing in a lot of good news. As such, we expect moderate gains in US equity markets in 2026 based on earnings yields and macro considerations, with 2H26 seeing more volatility than we saw in 2H25, and global markets generally faring better. In short, as a veteran investor smarter than we are succinctly put it: 2026 is likely a year where the economy does better than stocks.
As for non-AI capex trends, we see a few factors that could accelerate growth. These include monetary easing, OBBB tax incentives, and a potentially steeper yield curve – all potentially reviving non-AI corporate capex and reopening the small bank credit channel. This would bode well for small business hiring, and for small cap value stocks, which have outperformed the S&P 500 by an average of 12% after the end of the last five rate-cutting cycles.
In fixed income markets, we expect short rates to move lower in 2026, as the bond market expects two more rate cuts. Our view is the Fed will cut more than current expectations due to past commentary from the Administration. Moreover, if inflation remains sticky as we expect, and net new credit issuance (much of it to fund AI spending) is substantial, this implies a steeper yield curve. Therefore, we are cautious on rates markets, favoring leaning shorter-than-benchmark duration and idiosyncratic credit opportunities such as hedged convertible bonds and international bonds. As our Fixed Income Team highlighted all last year: all-in yields remain attractive. But we want to remain vigilant when it comes to credit risk. Moreover, with a flat yield curve that is unlikely to invert, there is no need to load the boat on duration to generate reasonable yields. Similarly, while we utilize private credit investments selectively in client portfolios, we believe a loosening of underwriting standards following a deluge of committed capital warrants heightened selectivity and caution in this area.
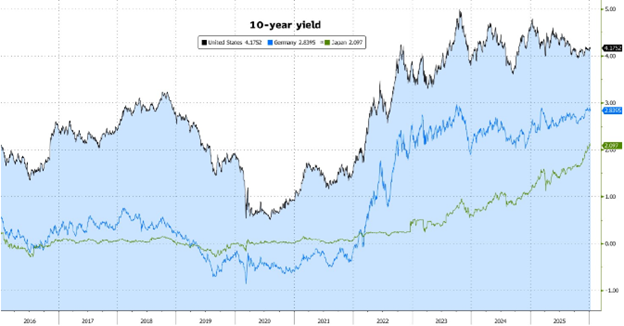
All in all, the “higher for longer” dynamic remains in place. This doesn’t mean rates will spike much higher, but rather the ultra-low rates we saw from the Great Financial Crisis in 2008 up until COVID are unlikely to return any time soon. From 2009 to 2022, 10-year Treasury yields generally traded between 1% and 3%, touching an all-time low of 0.55% in 2020. Since then, the trading range has been more in the 3% to 5% area. We expect this to continue in 2026. As of this writing, the 10-year Treasury yield (4.17%) sits almost exactly (4.18%) where it was when the equity bull market began in late 2022. Over the past two years, the trading range is even tighter: about 3.7% to 4.7%. As long as yields stay in this range, it provides stability for risky assets.
We like commodities as a preferred portfolio diversifier, with inflation remaining sticky and perhaps reaccelerating in 2H26. Gold certainly performed well in 2025, but we prefer a diversified portfolio of commodities (via liquid, low-cost funds) that has a more direct linkage to inflation across the manufacturing and industrial complex.
All the aforementioned dynamics imply, at best, a stable US dollar with fundamentals (fiscal spending, valuation, sentiment) remaining attractive in international stock markets, both developed and emerging. International stocks had a great 2025. Investors who largely missed that trade (by being myopically focused on US markets) were quick to write off 2025 as a one-off event driven by a weak dollar, and an ill-advised bet against US stocks (especially US technology stocks). We do not agree. For one, we have a hard time seeing a sustained US dollar bull market given the likely lower trajectory of US interest rates in 2026. Moreover, one of the largest geopolitical impacts of the Trump 2.0 Presidency has been the continued reversal of globalization, driving re-industrialization and deficit spending in Europe:, a tailwind for European stocks. With 9 out of 10 G10 central banks in easing mode, the dovish impulse we see from the Fed is mirrored across the globe. From a relative valuation perspective, international stocks are cheap, trading at about a 30% lower P/E than the US. However, earnings growth in many countries (e.g. Japan) is markedly higher than in the US (the tech sector excluded). In our view, the valuation disconnect remains too extreme. Finally, several of the most critical global tech companies (one of which we hold a significant position in across nearly all client accounts), are based outside the US. We continue to maintain a healthy exposure to International stocks.
Risks to Our Outlook: Throwing Stone
What could go wrong in 2026? First, our view on interest rates. Our base case is that short rates fall (likely more than priced) but long rates don’t, and they may even rise. However, a parallel shift lower in the yield curve would presumably be very bullish for risk assets. In this scenario, our diversified portfolios would likely lag the stock market but presumably generate reasonable positive returns.
If the Fed cuts too much, too fast, and inflation resurfaces as a major problem and the Fed loses credibility, we could see the yield curve steepen in the extreme. Bonds and stocks would both fall. Our portfolios (like virtually any long-only investor’s) would lose money, as they did in 2022, but exposure to commodities and alternatives would help mitigate the downside.
A recession is another obvious risk to our outlook, and not our base case (and another scenario where our bias to asset-class diversification should attenuate downside risk). It is certainly possible that the expansionary drivers we see for 2026 fail to materialize:
- AI capex (private fixed investment) has peaked
- Non-AI companies choose not to spend on AI to compete with their peers
- Tariffs increase further
- Mass deportations occur, creating further productivity drag
- The labor market substantially weakens
- The Administration does nothing to cut taxes or pay out stimulus
We do not see any of these things happening in 2026. As mentioned earlier, the immigration and tariff headwinds we saw in 1H25 are unlikely to repeat (though certainly other downside risks exist). That said, we know there will be another recession at some point. So, what data points should we be focused on that might cause our recession odds to increase, and our portfolio positioning to become more defensive?
Much was made of the Treasury yield curve inverting (10-year yields below 2-year yields) in 2022, triggering recession concerns. While we have been experiencing a recession in pockets of the domestic economic (e.g. freight and shipping) for several years, we never entered a textbook National Bureau of Economic Research recession. If one looks at history, it isn’t actually the yield inversion that signals a coming economic problem. Prior to the GFC, for instance, the yield curve inverted in early 2006. The US did not officially enter recession until two years later, after the yield curve steepened to 1%. If we look back over the past 50 years, this a consistent pattern. Other than short-lived and unique COVID-induced recession in 2020, every recession since 1976 has been preceded by a yield curve that inverted and subsequently steepened to 1% (i.e. 10-year yields 1% above 2-year yields.
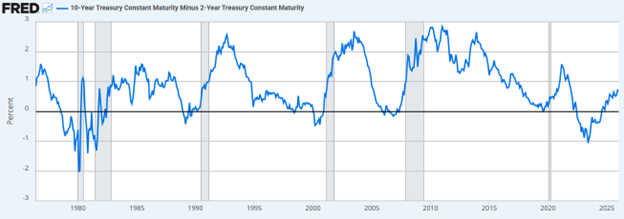
Why would this be? We can construct a narrative that generally accompanies these interest rate movements. The Fed tightens rates in response to an overheating economy (as the Fed did in 2022 and 2023). The economy begins to slow. (We are seeing pockets of this now, certainly in housing and certain consumer cohorts, but wealth effects, fiscal stimulus (OBBB), and AI spend are offsetting it, for now.) The Fed then begins to cut rates (as they did beginning in 2024), but perhaps not aggressively enough to boost the economy. Growth slows but the Fed is “behind the curve,” leading to aggressive but too-late easing that causes 2-year yields to fall 1% below 10-year yields. A recession ensues. With the yield curve at 0.7% as of this writing (up from 0.35% a year ago), this recession warning sign is not yet flashing, but it will bear close watching in 2026.
We hope your 2026 is off to a great start. Please reach out any time with questions.
We provide the information in this newsletter for general guidance only. It does not constitute the provision of legal advice, tax advice, accounting services, investment advice, or professional consulting of any kind. The information provided herein should not be used as a substitute for consultation with professional tax, accounting, investment, legal, or other competent advisers. Before making any decision or taking any action, you should consult a professional adviser who has been provided with all pertinent facts relevant to your particular situation. The information is provided “as is,” with no assurance or guarantee of completeness, accuracy, or timeliness of the information, and without warranty of any kind, expressed or implied, including but not limited to warranties of performance, merchantability, and fitness for a particular purpose.