


Market Outlook: Q1 2024, Higher for (Even) Longer
Wed, 05/01/2024 - 11:00 Wealth management

by John M. Fidler
Chief Investment Officer | (502) 259-2543 | John.Fidler@syb.com
Q1 REVIEW
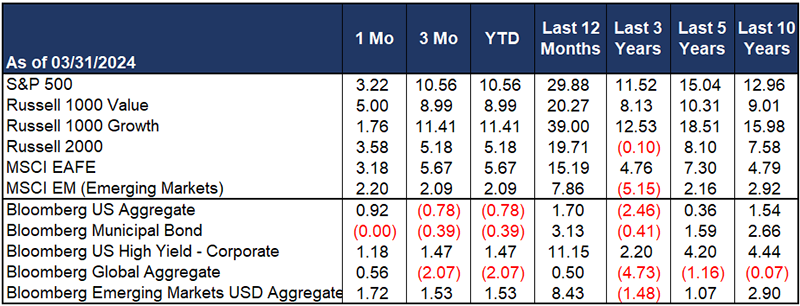
The stock market ebullience of 2023 carried into the 1st quarter of 2024 as global equities made new highs and the S&P 500 gained over 10%. The US economy remains resilient on the back of continued government deficit spending and a strong household wealth effect emanating from both the stock market and a rebounding housing market. Other factors contributing to economic strength are a credit market that, while tightening, is not yet overly restrictive and a labor market that remains strong.
During 2023, the secular theme of artificial intelligence (AI) was largely focused on the “Magnificent 7” tech and communications services companies. Enthusiasm for AI broadened to include not just larger swaths of the tech sector, but also other businesses perceived to be levered to AI. This includes both AI tool enablers (e.g. industrial companies providing cooling systems to the massive datacenters required to facilitate AI processes) and AI tool adopters (e.g. a fintech company that reportedly cut a third of their customer services spend thanks to AI).
In some ways, this has made the year-to-date 2024 market rally more broad-based than the Mag 7-led rally of 2023. Growth stocks have only slightly outperformed value stocks during Q1 2024. However, at the very top end of the market, we’ve seen increasing concentration with Apple (AAPL) and Tesla (TSLA) shares falling this year and Meta (META), Amazon (AMZN) and Nvidia (NVDA) the only Mag 7 stocks up substantially more than the broader market. While the highest quality AI-linked companies remain fully valued, if not overvalued, opportunities still exist to buy market leaders with a reasonable margin of safety. Alphabet (GOOGL) stands out as the clearest example of this. Even the rise in NVDA has been supported by explosive earnings growth (whereas the fall in TSLA seems more than warranted).
Strong early-year performance has historically been a harbinger of continued market strength throughout the year. Since WWII, market gains of over 6% have occurred in the January/February period 15 times. In 14 of those years, the market continued to gain from the end-February level through year-end by an average of +12%. One cause for concern is that the current market rally continues to be driven largely by multiple expansion as earnings estimates are roughly unchanged since the end of ’23. At some point we will need to see a hand-off to earnings growth (i.e. earnings estimates re-rating higher) to justify market valuations of roughly 21 times 2024 estimated S&P 500 earnings.
Coming into the year, we highlighted potential pockets of value outside of megacap tech stocks. While few equity investments have kept up with NVDA and META this year, the themes discussed last quarter have generally performed well, with much greater margin of safety and diversification benefits:
- Small cap stocks have gained 5% on the year, remain relatively cheap, and higher quality companies in this space should benefit from a continued recovery in M&A activity.
- Emerging market equities are up about 8% and the primary active managers we utilize in this space are well ahead of this benchmark YTD. Fundamentals in selected EM countries remain strong, though a stronger dollar poses a potential risk to this sector.
- Idiosyncratic sectors/themes such as infrastructure and energy stocks have outperformed the market. In the former category, companies like Emcor (EME) have rocketed higher and are difficult to add to at current levels. However, natural resources companies (energy, materials, and selected utilities) remain reasonably valued and are exposed to a potential resurgence in inflation.
- Diversifying alternatives strategies, which we tend to use as a diversifier to bonds, generated equity-like returns with bond-like volatility in Q1, much as they did in the bull market of 2021. The macro backdrop remains attractive for these strategies.
FIXED INCOME
While bond yields have risen and key bond indices are in negative territory this year, rates were not yet high enough to derail the stock market as they did in 3Q ‘23. Riskier parts of the fixed income sector, namely high yield and emerging market debt, eked out modest positive returns during the quarter.
As we predicted in past Outlooks, the “higher for longer” rate dynamic is still in place. So, while bonds represent reasonable value from a risk-adjusted yield perspective, especially for income-sensitive investors, we don’t anticipate meaningful capital appreciation from bond indices, barring a recession (not our base case).
Within fixed income, we continue to prefer intermediate positioning, as the yield curve should eventually steepen, going from inverted to a normal positive slope. If money market rates ultimately get to around 3% while 10-year Treasury yields remain around 4%, bond holders on the shorter end of the yield curve would benefit. As discussed below, this may be a slow process.
GROWTH & INFLATION
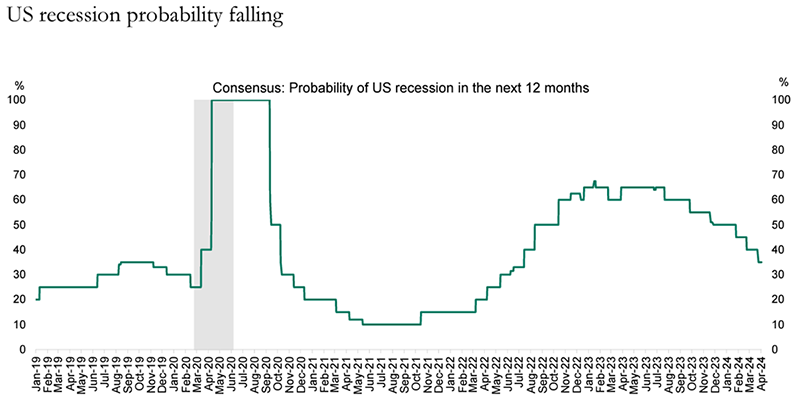
Economic growth continues to be resilient in the US. The Atlanta Fed is calling for around 2.5% real GDP growth for Q1 ‘24. The Fed’s most recent Summary of Economic Projections is looking for around 1.5% growth for full-year 2024. The consensus of economists shows a declining likelihood of recession in the next year.
However, the “last mile” in the fight against inflation is proving difficult, as we highlighted in our 2024 Outlook. Core inflation running between 3.5% and 4% remains well above the Fed’s 2% mandate. Importantly, typical items like rent, housing, and wages are driving inflation at the moment.
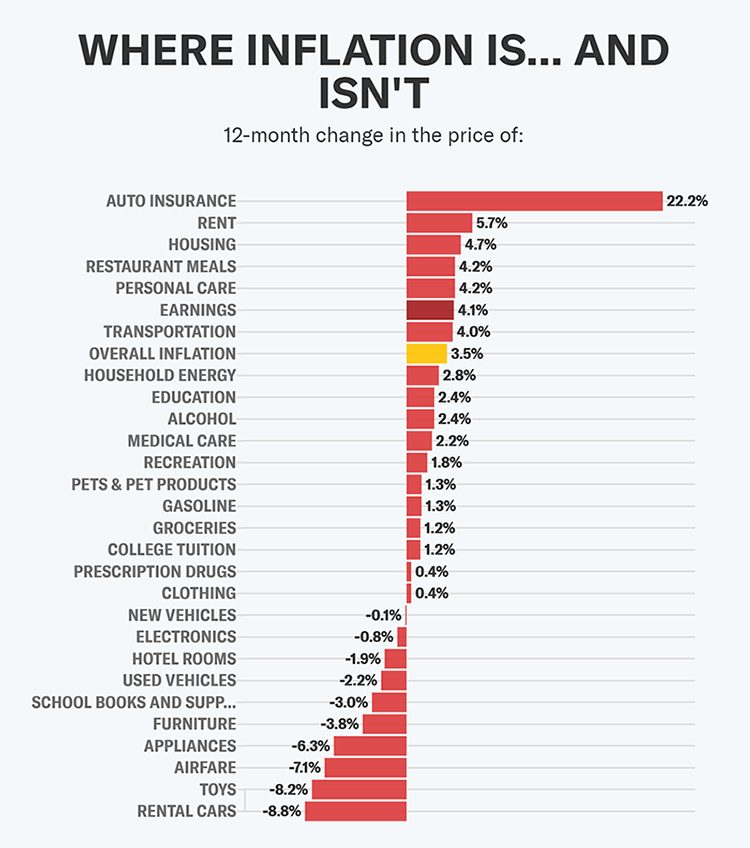
With the labor market still robust, inflation running at nearly two times the Fed’s target level, credit spreads at very tight levels and stocks close to all-time highs, there is very little justification for the Fed to cut rates.
Alas, “higher for longer” is still with us. The Fed still has more work to do, not necessarily in terms of the level of rates (we don’t foresee rate hikes) but in terms of the duration of time that rates need to stay at present levels in order to get inflation sustainably below 3%.
Q2 OUTLOOK
The six or seven rate cuts priced into bond markets following the Fed’s December “pivot” proved a fantasy. As of quarter-end, three cuts were still widely anticipated. Those probabilities have now been halved, to between one and two cuts, as of this writing in mid-April. Both incoming data and recent Fed comments now imply a potential for no cuts at all. Barring an event like last year’s banking panic or a sudden and shocking deterioration in the employment picture, there’s just no economic reason to justify cuts. Anything is possible in an election year, but we would certainly take the under on two rate cuts this year.
What does this mean for investors as we enter Q2? Our base case remains that inflation (and as a result interest rates) remains stubbornly high. This translates to a “bumpy landing” for the US economy, though not a technical recession. The only way to purge inflation from the system is to tighten financial conditions and that can’t happen without credit spreads widening (i.e. borrowing costs for riskier or lower-quality credits rising relative to those for good credits) and equities selling off. As interest rate volatility is digested by equity markets, one would expect a buyable market correction in the quality growth stocks we favor. To the extent inflation continues to run hot, it should benefit the energy, emerging market, and non-correlated alternatives allocations within portfolios.
One market narrative that we believe is important to understand in 2024 is the increasingly discussed concept of “fiscal dominance.” This refers to the idea that US fiscal deficits are lifting both growth and the stock market. The negative consequence of fiscal dominance is that it can mean a country’s debt and deficit levels are sufficiently high enough that monetary policy ceases to be an effective tool for controlling inflation, effectively outsourcing economic policy from the Fed to the Treasury.
This does not seem like a far-fetched description of the current macro backdrop when we consider that two years of relatively high interest rates has done little to curb consumer spending or slow household wealth growth. Much of this dynamic is likely related to consumers’ decreasing sensitivity to short-term rates: adjustable rate mortgages are a thing of the past, most other major financed purchases (e.g. cars) are tied to longer-term rates and wage growth has allowed consumers (for now) to absorb higher credit card and other loan balances.
As a result, the interplay of fiscal and monetary policy has become more important in this cycle relative to others we have invested through over the past two decades. Look no further than last October when bonds sold off sharply and fears of a buyer’s strike for US bonds began to take hold.
However, the Treasury reversed that 2023 sell-off through a “pivot” of their own, electing to finance the deficit with short-term bills instead of long-term bonds. This reduced the incremental supply of bonds, and helped lead to a vicious 4Q ‘23 bond rally, thus avoiding an unprecedented third consecutive year of losses for the bond indices. In this context, with the US 10-year yield approaching 4.5%, we will be closely watching how the Treasury chooses to finance the deficit (and how large that deficit will be) when they issue their Quarterly Refunding Announcement at the end of April.
Stepping back to look at the global picture, the Eurozone and Chinese economies continue to languish relative to the US. Germany and most of the EU are showing economy activity at recession levels. China is confronted with an ongoing malinvestment problem in the real estate sector and a currency that is structurally too expensive to facilitate strong growth. Global (ex US) economic weakness implies that central banks in much of the rest of the world should be cutting rates while the Fed stands pat. Real interest rates in the US should remain at substantially higher levels than overseas. Does a tighter Fed imply a much stronger US dollar? And does this, in turn, imply a major structural headwind for risk assets?
In short, we don’t think so. Yes, almost all other major central banks need to cut more than Fed does. Yes, the March highs in the equity market may prove a local high as we see April outflows to pay tax bills, a more hawkish Fed, and the “sell in May and go away” seasonal. To be clear, we are not adding aggressively to risk at current levels. But “big picture” we think a meaningful market correction will be a place to add risk.
BACK TO THE FUTURE?

So, how can the dollar, stocks, and bonds all move higher given a hawkish Fed and a dreary fiscal outlook? In 2022, we discussed the risk of stagflation as growth appeared to be slowing and inflation was rampant, sparking fears of a 1970s redux. Last year we wrote about the potential return of the bond vigilantes of the 1990s.
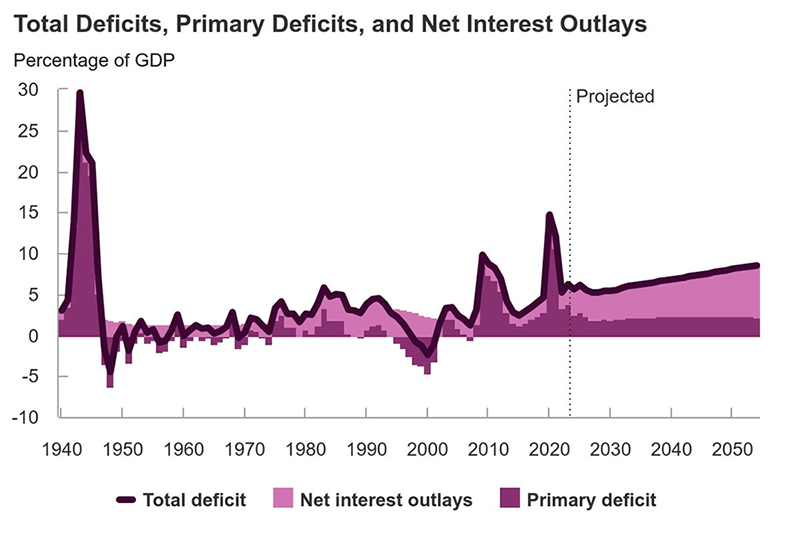
Perhaps the 1980s is the better decade to look at as we think about what we see today. The US is currently running a huge deficit, over 5% of GDP. As can be seen in the CBO chart above, the only time we’ve seen deficits of this magnitude was during large scale wars (WWII and Vietnam) or severe recessions (1981, 2000, 2008 and 2020). In short, the US has never run a deficit this big in a peacetime economic expansion.
Moreover, interest cost on that debt has gone up as rates have risen since 2021. We are now paying about $1 trillion interest annually on the growing national debt. This equates to between 3% and 4% of GDP.
The news media loves to terrify viewers with the size of these admittedly big numbers. But the reality is they have been bigger in the past. From 1981 until 1998, the annual interest cost was above 4% of GDP and was around 5% from 1984-1991.

I was not an active investor from 1981 to 1998, but I’m sure many readers of this Outlook were. During this period, there were recessions, expansions, bull markets, bear markets, a savings and loan crisis, and wars, both hot and cold. Never the less, the 80s and 90s were a good period for the economy, markets, and America. The economy grew massively, interest rates fell steadily, the stock market rose ten-fold, and living standards rose. There are many reasons for this and I will not pretend that all of them apply to the current day. For instance, there is certainly no clear analog to Ronald Reagan in this comparison, based on the two presumptive Presidential nominees.
However, the point is that there is a historic precedent for a secular bull market in stocks, bonds and the US dollar, all at the same time, all in the context of a seemingly unwieldly deficit problem. George Soros, one of the great global macro traders of all time, coined the term “Reagan’s Imperial Circle” in his 1987 book “The Alchemy of Finance.” In this scenario, a country with loose fiscal policy and tight monetary policy can drive currency strength alongside economic growth and asset appreciation. We have seen it before and perhaps we will see it again.
We provide the information in this newsletter for general guidance only. It does not constitute the provision of legal advice, tax advice, accounting services, investment advice, or professional consulting of any kind. The information provided herein should not be used as a substitute for consultation with professional tax, accounting, investment, legal, or other competent advisers. Before making any decision or taking any action, you should consult a professional adviser who has been provided with all pertinent facts relevant to your particular situation. The information is provided “as is,” with no assurance or guarantee of completeness, accuracy, or timeliness of the information, and without warranty of any kind, expressed or implied, including but not limited to warranties of performance, merchantability, and fitness for a particular purpose.