


Q3 2025 Market Outlook: Jekyll & Hyde Markets
Wed, 07/23/2025 - 16:19 Wealth management

by John M. Fidler
Chief Investment Officer | (502) 259-2543 | John.Fidler@syb.com
Q2 2025 Review: From “It’s All Over” to “We’re So Back” in 80 Days
The second quarter featured some of the wildest market volatility in memory but, in the end, most asset prices moved higher during the quarter. If there is one lesson from the past three months, it is to ignore the panic and euphoria peddled by the financial media. With “markets in turmoil” on CNBC following Liberation Day, the pundits and many Wall Street economists were calling for imminent recession. “It’s all over” for the bull market was the consensus as investor sentiment reflected mass panic. Only after markets rocketed higher in April and May did the talking heads turn bullish, usually in the most speculative and potentially overvalued corners of the market. As of this writing, “we are so back” and investor sentiment verges on giddy. Even a hot war in the Middle East could not significantly derail the markets.
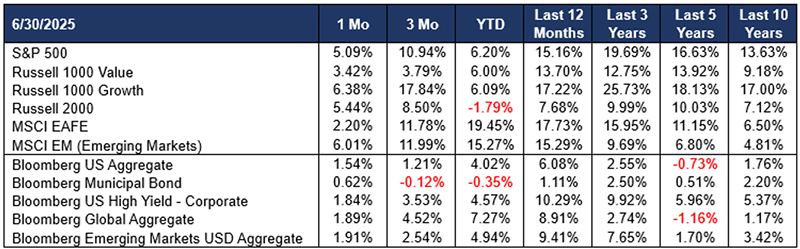
As discussed since the beginning of the year in earlier posts, the current volatility (both up and down, volatility can mean both!) is reminiscent of the previous trade war period in 2018-19, when the US stock market rose about 20% over two years but experienced six declines of 10% or more, and one 20% correction. Already in 2025, we have seen a 20% correction (Hyde) followed by an even larger rebound (Jekyll).
This market action confirms a few immutable (if boring) investment truths. It pays to stay invested, because earning assets (stocks, bonds, real estate) outperform cash over the long run. At the same time, it pays to diversify at the asset class level (including holding some cash) because all asset classes experience prolonged bear markets at some point. The 1970s were a “lost decade” for stocks and bonds, but a great time to own commodities. The 1980s were fantastic for bond investors, but commodities collapsed. Since the Great Financial Crisis, stocks (especially the largest US growth stocks) have outperformed. Bonds, commodities, and most diversifying assets (other than gold) have not added much absolute performance to portfolios over the past 5-10 years. Nonetheless, ever-changing market cycles are a constant of markets, and no one asset class will generate superior risk-adjusted performance forever.
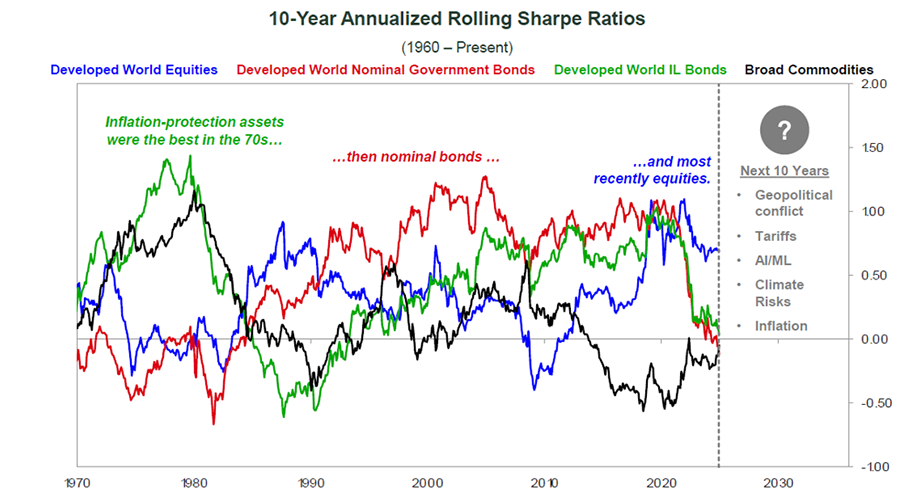
For instance, foreign equities, which lagged for years, have significantly outperformed US equities year-to-date. Time will tell if this the start of a larger secular trend of “the end of US exceptionalism” in financial markets. A related and important market development in 2Q, not shown in the table above, is the weakness of the US dollar, which fell about 7% in 2Q25.
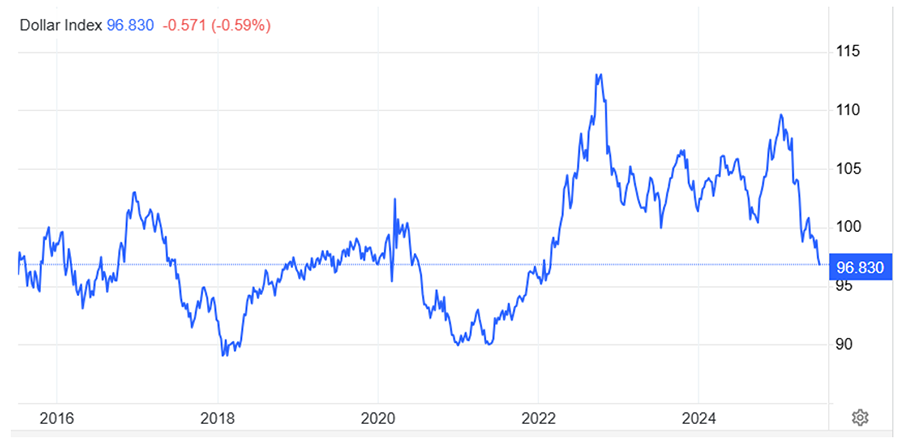
Again, we see financial markets in 2025 “rhyming” with those in the first Trump Administration, when initial dollar strength in late 2016 reversed into significant dollar weakness in 2017. While the dollar is oversold on a short-term basis, there are a confluence of structural factors driving the weak dollar trend:
- a Federal Reserve likely to cut rates later this year,
- a European Central Bank that may do the opposite,
- a world where US assets are over-represented in investment portfolios (see below),
- and the potential for an extremely dovish Fed Chair to replace Jay Powell next year.
As Treasury Secretary Bessent said at the end of June: “We are seeing for the first time a real attempt at defense spending in Europe. We are seeing the Germans take off the debt brake. More fiscal spend would tell you that the euro should appreciate.” This trend has investment implications for allocations to both international stocks and the real return component of portfolios, which we will discuss later.
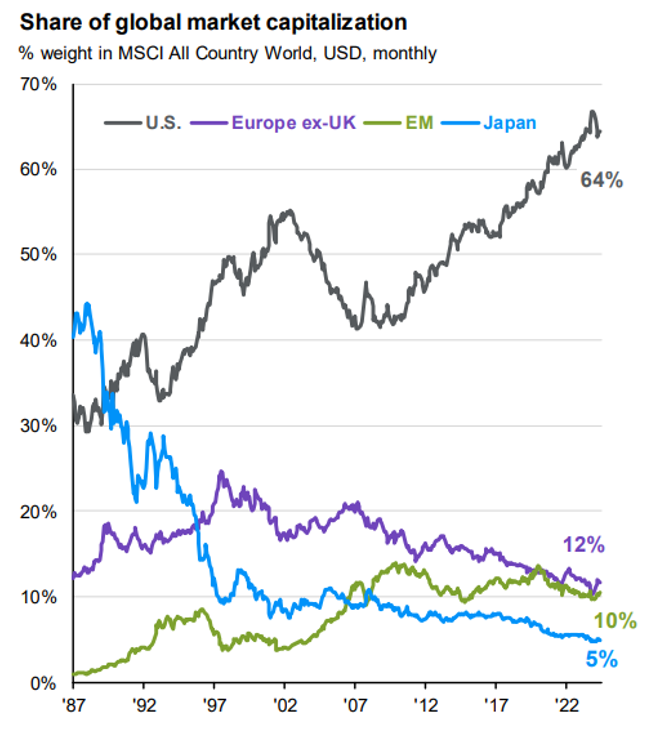
Buy and hold investing works (provided one buys the right assets), but tactical asset allocation shifts to one’s long-term investment mix, based on relative valuations and risk premiums, can also improve returns and/or reduce risk. By building diversified portfolios, not always being fully invested, keeping an open mind, and sticking to a disciplined investment strategy framework, we can use volatility to our clients’ advantage, as opposed to being shaken out of the market.
Q3 2025 Outlook: Bulls, Bears, and Stags
Where do we go from here in 2H25?
The bull case for traditional stock/bond portfolios going forward is: more of what has played out since mid-April. Specifically, a continued policy de-escalation towards the post-COVID status quo of deficit spending, relatively free trade, and dollar debasement, leading to income-driven economic growth and continued double-digit corporate earnings growth. The trend looks to continue as things settle down in Washington, trade deals get done, pent-up demand emerges as the economic policy focus pivots towards tax cuts and deregulation, and the economy rebounds. Tariffs serve to increase consumer costs (they are effectively a tax increase) but prove to be a one-time hit versus a sustained inflationary pressure. Furthermore, the impact of artificial Intelligence will begin to drive productivity gains meaningfully. Consistent with the 1980s and 1990s, stocks and bonds will both rise meaningfully, eclipsing the fears over deficit spending, inflation and the weakening trend of the US dollar. Markets may continue to overcome the proverbial wall of worry as they have for most of 2Q, especially in the longer term, but this is not our base case for 2H25, considering elevated valuations, a slowing economy, sticky inflation, and escalating tariff policy in July.
The bear case focuses on current tariff rates of 15-20% (and rising) versus around 3% a year ago, far worse than pre-Liberation Day expectations and equivalent to the largest tax increase in history. Trade war and economic uncertainty serve to hinder corporate and consumer decision making, resulting in “belt-tightening” behavior. The result is declining corporate profits leading to job losses, a decline in household wealth, and a “hard landing.” In this scenario, equities fall below their April 9 lows as the AI bubble deflates, and Treasury bonds rise in a classic recession trade. Core economic growth, as measured by real final sales to private domestic purchasers, which strips out the noise around tariffs and inventories, is at the lowest level since 2022. A 2025 recession is certainly possible, but we do not believe the current data support such an outcome. Bears were quick to point to the weak ADP employment survey for June as a sign of underlying weakness, but June non-farm payrolls data were strong, tax receipts remain robust, and labor demand (job openings) is picking up.
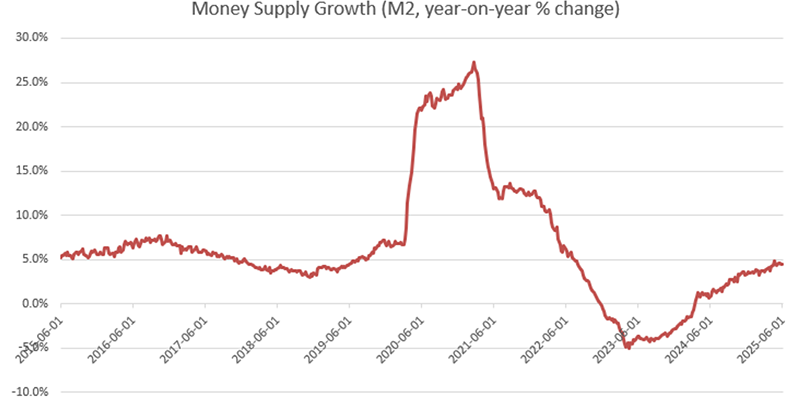
A potentially worse scenario would be stagflation due to a slowing economy coupled with tariffs and immigration restrictions boosting already-sticky core inflation. In this narrative, stocks and bonds fall together, as we saw in 2022. We view this as unlikely, in large part because inflationary concerns around tariffs are misplaced. As Milton Friedman wrote, “inflation is always and everywhere a monetary phenomenon.” Inflation rose to multi-decade highs in 2021-22 from unprecedented money creation in response to COVID, while inflation rates fell in 2023-24 as the Fed raised rates and the money supply shrank. Sticky inflation in 2H25 will have more to do with money supply growth of around 5% than with tariff rates. As such, we expect inflation around 3% for 2025, but nothing like the severe and widespread inflationary pressures we saw in 2021-22.
At the risk of sounding boring, we expect a middle-ground outcome. The “muddle through” scenario in which uncertainty lingers and growth slows, but not to the extent that we experience a recession. Investors got Mr. Hyde the first week in April and Dr. Jekyll ever since. We suspect this summer melt-up may continue. The bar for 2Q earnings growth (just 4%) and a strong July seasonal are supportive. But we are wary of seasonal September weakness ahead of critical upcoming Fed meetings, as the market wrestles with a higher bar for 2H25 earnings growth (10%+) and a potentially hawkish Fed. At the beginning of 2025, we wrote that we expected “a modest up year with a lot of volatility” for equities. So far, that’s how things are playing out and we think that will remain the case.
Asset Allocation Isn't a Fun Story
People like talking about stocks. They like investing in stocks. They like trading stocks. This is because stocks tell a story. Stocks are all about dynamic founders (think Elon and Bezos and Walt Disney and Henry Ford). They’re about the future, about the dynamism of capitalism, about growth. People like stories. Every year, there’s some stock that goes up 100% and every decade there’s some stock that goes up 100x. So, part of why people like stocks is the same reason people like casinos and playing the Powerball. By comparison, bonds are boring. Commodities are boring (despite all the volatility, oil prices have gone nowhere for a decade). Cash is the most boring. Alternative investments are complicated. And talking about how to mix a portfolio of these investments in an optimal way? Nerd alert!
But research shows that asset allocation decisions (i.e. how we build a portfolio of assets and rebalance exposures over time) drives 90% of the performance of an investor’s portfolio1. This is why, when we onboard a new client, we spend a lot of time talking about the factors that go into their “Investment Policy Statement” (IPS). Just the phrase “Investment Policy Statement” sounds boring. But the reality is, whether that IPS targets 60% equities or 60% bonds will have a much greater impact on future investment performance than whether a diversified portfolio owns Coke versus Pepsi.
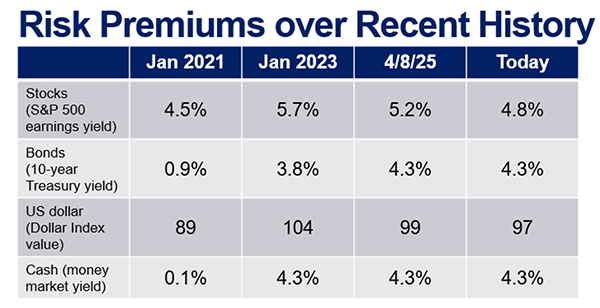
What assets to select in building portfolios, and how to shift those allocations over time, is the crux of portfolio management. Start with the risk premiums shown on the table above, you’ll notice they change over time. The higher the risk premium, the higher the expected return, and the more an investor should be inclined to tilt their allocation in its favor.
Building Blocks
What asset classes should we consider as portfolio building blocks and how should we segment them?
Equities should generally be the fundamental building block of diversified portfolios. A global equity portfolio includes the listed public equities common to most wealth management portfolios (domestic, developed international, emerging markets, small/mid cap). They might also include private equity, private credit, and directional hedge funds whose performance is correlated to the global equity markets.
The stable value component of a portfolio most commonly includes Treasury bonds, cash, and other low-risk bonds like agencies and municipals. Non-correlated or market-neutral hedge funds could also fall into the category (for instance, the convertible arbitrage strategy we highlighted in last quarter’s outlook). Investment grade corporate bonds straddle the line between these two categories, as they provide stable value (safe bonds with very low default rates) but are also tied to the financial performance of a company.
Real return investments provide protection against inflation. Real estate, infrastructure, and natural resources are the main categories here. This could mean something as “plain vanilla” as Chevron common stock or a listed REIT, or something as exotic and illiquid as a fund that invests in farmland or whiskey barrels.
Below we see a graphic representation from a major US university system endowment on how they think about, and size, these different exposures. The exact allocations and sub-categories included will vary by client, but this is a rational way to think about asset allocation and the problems each silo solves for.
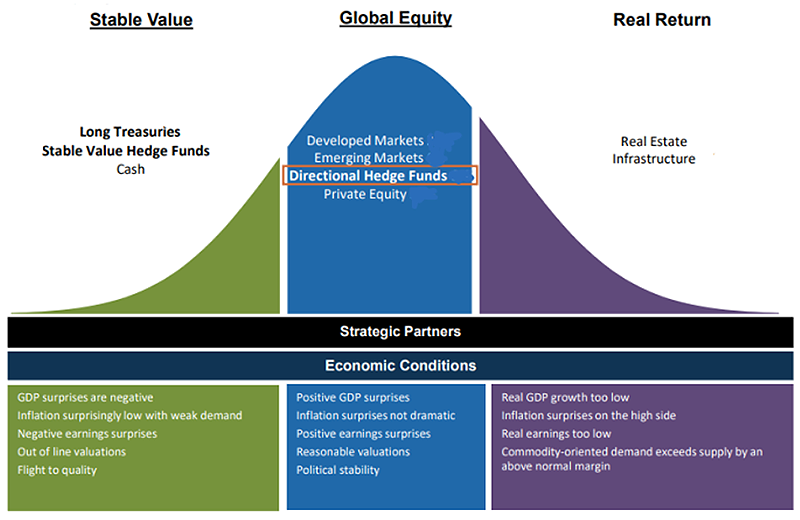
Importantly, we think it is imperative for investors to think about “income” distinct from “protection.” Risky assets with yield such as high yield bonds, dividend-paying stocks, and private credit will boost portfolio income. But these all have at least one foot in the “global equity” bucket and therefore will typically fall in value when equities fall in value. Diversifying or safe-haven assets – US Treasury bonds, gold, stable value hedge funds, cash – have the ability to generate positive returns (or at least maintain their purchasing power) when equities fall, but are unlikely to outperform the equity markets over the long term.
At a basic level, stocks should return more on a go-forward basis when valuations are low. We can estimate a long-term expected return by adding together futures earnings, dividends, and the impact of stock repurchases (which increase earnings per share by decreasing share count). So, we add together the earnings yield of the market (inverse of the price-to-earnings ratio (P/E)), the dividend yield, and the “buyback yield” (the percentage of total market capitalization that is bought back by companies each year).
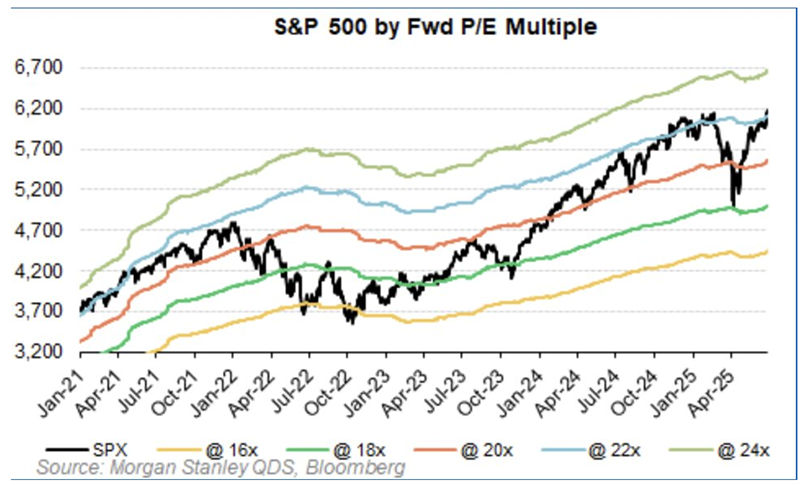
Currently, with the S&P 500 at 6300, and 2026 earnings expectations at around $300, the forward P/E is around 22x, so an earnings yield of 4.5%. Add dividend and buyback yields of about 1% each, and we get a long-term expected return of something like 6-7%. With core economic growth slowing, earnings growth is likely to slow as well. And without an acceleration in earnings growth, uninterrupted equity market gains will be difficult to achieve, as stocks tend to spend little time valued above about 22x forward earnings (see below).
When thinking about valuations, the level of the US dollar and 10-year Treasury yields are important starting points. The textbooks tell us that the value of a stock is the net present value of all its future cash flows. If the long-term interest rate is zero, those cash flows are discounted at zero, and so the appropriate value of stocks is high. In a world where long-term rates are 4-5%, the appropriate multiple is lower than in the past when rates were much lower. Sustained dollar weakness (strength) may also make US assets less (more) desirable for foreigners to hold.
Moreover, we need to compare the expected return of equities (which are “risky” assets) with the expected return on bonds (which are theoretically risk-free). When long-term rates approached zero and stock market earnings yields were 6%+, there was “no alternative” to stocks (recall our “TINA” and “TARA” presentations from a few years back). With both the risk-free rate and the expected return on equities in the mid-single digits, the asset allocation decision between the two is less clear cut.
Expected earnings growth also matters for equity valuations. With European governments practicing austerity policies in the 2010s, developed international markets were a frustrating value trap for a long time. Their valuations were cheap, but there was no catalyst for those valuations to change or for earnings growth to accelerate. Now, as Scott Bessent alluded to, with Europe focused on re-industrializing and re-arming, European deficit spending represents just such a catalyst (as we have seen this year).
(The Right) Stock for the Long Run
As the overview of strategic and tactical asset allocation above hopefully illustrates, we do not believe in blindly allocating an outsized portion of capital to stocks regardless of the valuation or macro backdrop. However, within asset allocation, an equity-centric approach makes sense because equities should outperform cash and bonds over time.
Though asset allocation is critical, stock selection does matter. Research shows that nearly 60% of companies that have been public in the US over the last century have failed to create value (defined as total shareholder returns in excess of 1-monthy Treasury bills). Moreover, only 2% of companies were responsible for over 90% of total wealth creation. This explains why poorly-diversified active strategies often underperform market averages.2
How to make sure our portfolios have enough exposure to the 2% of companies that will drive wealth creation, and avoid the 60%+ of companies that don’t outperform T-bills? Our approach is to own high-quality businesses with growing cash flows, because those are the businesses that have a shot to be in that 2%. But these characteristics are not always obvious except in hindsight. Today’s high-quality businesses may not stay that way (think Xerox or Kodak). Many of today’s high growth businesses will be low growth in the future (think many of the money-losing meme stocks discussed on CNBC).
We recently spoke with an experienced investor who we respect a lot. He pointed out that while the individual holdings of his stock portfolio might seem diverse in terms of size or industry sector, and fail to fall clearly into the false paradigm of “growth vs value,” their unifying characteristic is that they are all “toll roads.” As Warren Buffett popularized it, this means that the business has a competitive advantage and can reliably generate income by charging for essential services or access.
We would agree that these types of companies often make the best investments, but would also carry this concept a step further. A toll road business with a limited total addressable market (TAM) may not be a good investment. If we literally owned the toll bridge across the Ohio River, we own a quasi-monopoly business with low ongoing capital costs, durable pricing power, and predictable revenue streams. Good investment, right? Maybe, but the growth of those revenue streams is limited to the growth of auto traffic over the Ohio River. Our TAM is limited to cars traveling between Kentucky and Indiana. On the other hand, a business like Costco has a TAM of nearly every consumer in the US who can afford to pay the annual membership fee. A business like Visa has a TAM of every credit or debit card in the world. The scalability of the internet and subsequent platform shifts, of which the AI revolution is just the most recent, makes technology enablers a perfect example of this. When we layer a large TAM on top of a highly scalable, toll-road business with good management (who can widen their competitive advantage through intelligent strategy and capital allocation), we can easily see why a company like Nvidia or Palo Alto Networks or Amazon has been such a good investment. We can then apply this model to identify future investments. While near-term trade and policy risks are real and valuations are demanding, we are still early in the AI revolution and there will continue to be wealth creation in this area (though yesterday’s winners may not always be tomorrow’s).
We hope your summer is off to a great start. Please don’t hesitate to reach out to me and anyone else on the SYB Investment team if you have questions or if we can be of assistance.
1Source: Financial Analysts Journal, Vol. 42, No. 4 (Brinson Et. Al. (1986) – Determinants of Portfolio Performance)
2Source: Journal of Financial Economics, (Bessembinder (2018) – Do Stocks Outperform Treasury Bills?)
We provide the information in this newsletter for general guidance only. It does not constitute the provision of legal advice, tax advice, accounting services, investment advice, or professional consulting of any kind. The information provided herein should not be used as a substitute for consultation with professional tax, accounting, investment, legal, or other competent advisers. Before making any decision or taking any action, you should consult a professional adviser who has been provided with all pertinent facts relevant to your particular situation. The information is provided “as is,” with no assurance or guarantee of completeness, accuracy, or timeliness of the information, and without warranty of any kind, expressed or implied, including but not limited to warranties of performance, merchantability, and fitness for a particular purpose.