


Q4 2025 Market Outlook: Acrophobia
Fri, 10/24/2025 - 16:19 Wealth management

by John M. Fidler
Chief Investment Officer | (502) 259-2543 | John.Fidler@syb.com
Q3 2025 Review: Strong Like Bull
The one-way rally in risk assets following April’s Liberation Day panic continued in the 3rd quarter, as all major asset classes posted gains. Resilient economic growth, the ongoing artificial intelligence (AI) platform shift (and associated infrastructure spend), a pro-cyclical fiscal deficit, and a Federal Reserve in easing mode all contributed to reverse the policy-induced growth scare experienced in April.
The S&P rose over 8% and diversifying equity sub-sectors like small caps, developed international, and emerging markets all posted gains. International markets remain well ahead of US stocks YTD, continuing the “rest of world” outperformance we noted last quarter, a welcome development for diversified investors.
Fixed income markets also generated gains as interest rates fell, pricing further Fed easing. The Bloomberg US Aggregate gained about 2%, and municipal and high yield bonds rose similarly.
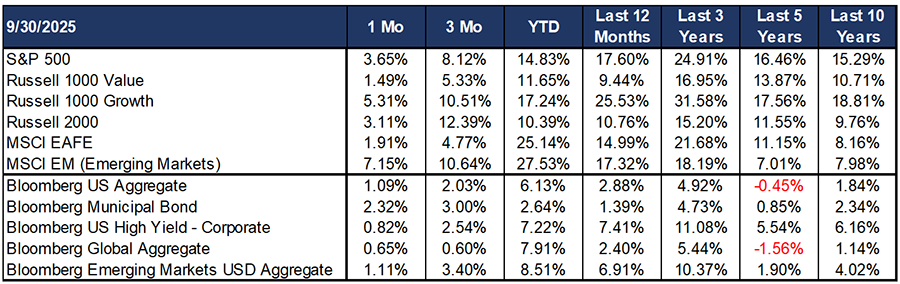
In all, as we closed out the quarter, April’s fears of capital flight (when US stocks, Treasury bonds, and the US dollar all declined together) seem a distant memory. While those fears were overstated at the time, we still believe long-term capital flows in response to historically high tariff rates, eroding Federal Reserve independence, and sustained deficit spending warrant portfolio balance between domestic and international assets, as has been evidenced this year.
Investing at All-Time Highs
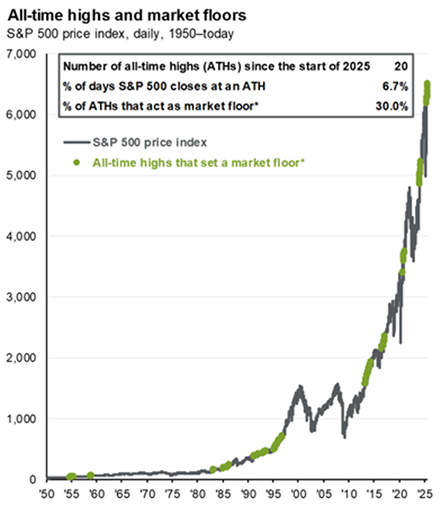
Fear of heights (or acrophobia) is an understandable human reaction. If you put me at the edge of a tall building, I’ll be afraid I might fall, even though I probably won’t. The fear is understandable, but maybe not entirely rational. The same is true in investing. Fear and greed are the two emotions most detrimental to investors. Typically, investors are most fearful during big market declines (like in April) and prone to make the error of reducing risk at the worst possible time. Similarly, investors are usually most greedy after huge market run-ups and prone to make the error of increasing risk at the worst possible time.
A perhaps more evolved, but not necessarily any more rational, cognitive bias is the investor who is afraid to put money to work solely because the market has gone up a lot. The data tells us that investing when the market is at all-time highs is not as bad a decision as one might think. Since 1950, the market has closed at an all-time high about 7% of days. Fully a third of those days marked a floor which the market never declined below (so far).
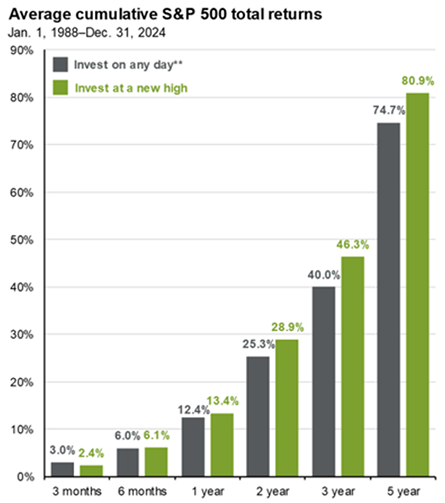
If we look at all rolling time windows since 1988 between six months and five years, investing at all-time highs has actually yielded better returns than investing on any day chosen at random. Only over very short windows (three months or less) and very long ones (10 years or more) do price returns from an all-time high entry point look worse than average.
So, high prices alone aren’t a reason to avoid the stock market. But surely high valuations are, right? Even if you’ve merely glanced at the Wall Street Journal or CNBC this year, it’s been difficult to escape the constant comparisons to the 1990s dot-com bubble and claims that we are currently in an “AI bubble.” The current market is certainly frothy in our view, but this information alone tells us very little about whether to stay invested or not over the medium term. Most bull markets realize their biggest returns in the last 6-12 months, and while we like to think we are reasonably smart, no one on our team can tell you with certainty that we are 6-12 months from the end of this bull market. (Anyone who does make such a claim, please don’t give them your money to manage.) Moreover, as we’ve discussed in prior Outlooks, high entry valuations suggest lower expected returns over long time periods (expected returns over the next 10 years are lower than realized returns over the past 10 years) but have little statistical value in predicting market performance over the next 1-5 years.
Bubble-licious
Is there reason to think we are in the late innings of an “AI bubble?” Even if we assume we are in a “bubble environment,” is 2025 more analogous to 1998 or 2001? Recall that Alan Greenspan’s famous “irrational exuberance” speech was given in 1996: a full five years before the dot-com bubble burst.
While the next painful market correction (one thing we can guarantee: there will be one at some point) could happen at any time for any reason, the data does not support the idea that the market is at completely unsustainable valuations. In fact, if we look under the hood just a little bit, the data looks very different from the dot-com bubble.
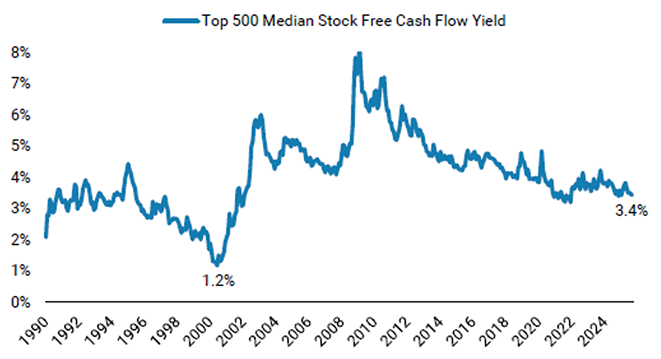
For a start, the infrastructure investment being made in fiber in the late 1990s was being built out using debt (and that fiber wasn’t ultimately needed for many years). Today, the hyperscaler companies building out datacenters are financing that capital expenditure out of cash flow (and the resulting computing power is in short supply). As a result, free cash flow yield is much higher today than it was in the late 1990s:
Having said that, today’s tech giants are certainly spending a lot more of their cash flow than they were even two years ago. Meta, for instance, spent 25% of their gross profits on capex in 2023. That number will rise to about 45% this year and is expected to be closer to 60% by 2027. So, the current rate of spend, absent a substantial increase in return on investment, isn’t sustainable forever. But the reality is that companies like Meta are still generating a ton of cash (Level 3 Communications or Global Crossing were NOT in 2000).
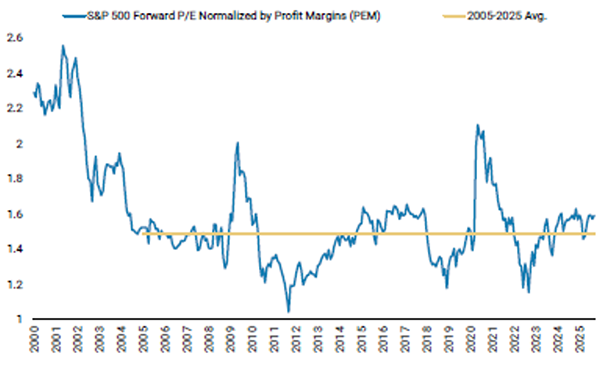
Looked at another way, the Level 3s and Global Crossings of the world in 2000 were not super-profitable. Microsoft/Alphabet/Meta/Amazon/Oracle are. If we adjust valuations for profit margins, the market isn’t just cheaper than in 2000, it actually looks cheaper than it did in 2021.
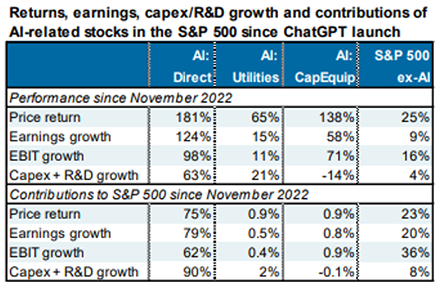
To be sure, we have seen increasing concentration in market leadership over the past 2-3 years. By one estimate from Michael Cembalest at JP Morgan, 46% of the S&P 500 market capitalization are “AI related” (41 different companies), compared to just 29% for those same 41 companies when ChatGPT launched in November 2022.
Such extreme market concentration has been a harbinger of market tops in the past. But it’s also hard to argue that the relative performance of those 41 stocks has not been well-supported by financial performance and economic profits. Over that time period, the 29 direct AI beneficiaries within that stock basket have seen their stock prices rise 180%. But that price performance has been supported by 124% earnings growth. The 459 companies not “AI related” have grown earnings just 9% (and their stock prices have increased 25%).
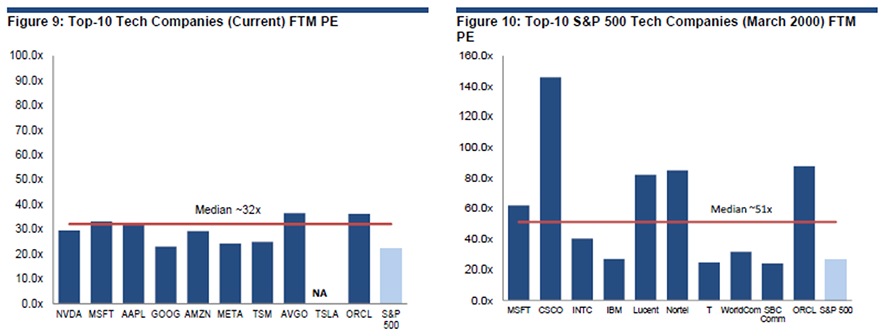
If we isolate the market leaders in the current period compared to those in 2000, relative valuations again do not look as frothy as the dot-com bubble.
The Stock Market Isn’t the Economy, but…
So, valuation alone is not a reason to avoid the stock market and, adjusted for profitability, the market suddenly looks less expensive. But surely this isn’t sustainable, right? Surely all this “AI investment” isn’t translating into real economic gains, right? Well, at least for now, the opposite is true. We expected the productivity hit from tariff and immigration policy to translate into an economic slowdown. This happened in April and May. And we may see more economic shoes drop as tariffs flow through the economy but what’s happened since April is a rebound in economic growth.
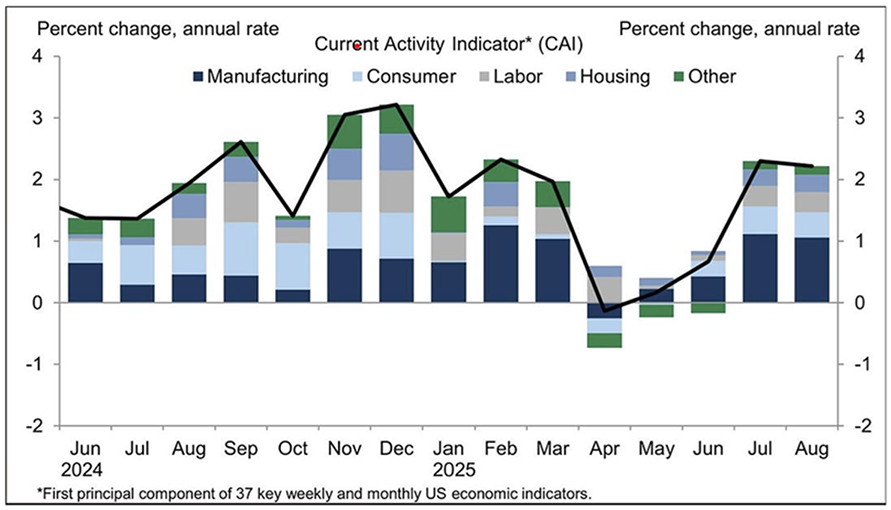
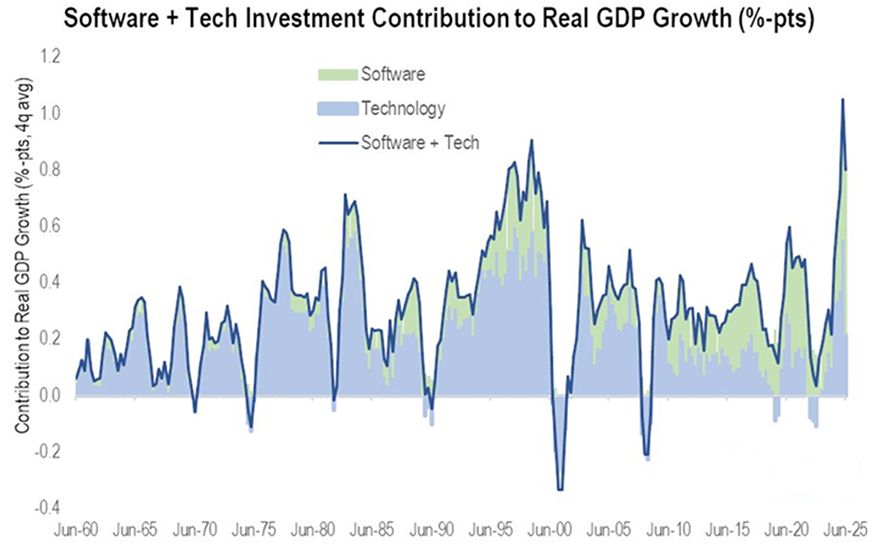
There are a variety of factors at play here, and admittedly we think sustainable real growth for 2026 is closer to 1%. But clearly something is driving an improvement in the data. At least one driver is the AI capex boom. Software and technology investment is currently contributing nearly a full percentage point of growth to GDP. That may not sound like a big number, but it is when we consider that (1) that’s a bigger contribution than during the dot-com bubble and (2) that domestic private GDP grew at less than 2% in the 2nd quarter.
No Froth Here
Despite all the evidence cited thus far, there’s no doubt that US large cap stocks are not cheap. We are tactically trimming the most aggressive holdings in portfolios, not adding (but we also aren’t going to cash, to be clear). But the 41 “AI related” stocks are not the only pond we have to fish in when it comes to stock selection. Importantly, two major diversifying equity sub-sectors are relatively uncorrelated to the bubble-like dynamics of the S&P 500. The first are small cap US stocks which, as the chart below shows, are as cheap as they have ever been relative to both Mag7 tech stocks and large caps as whole.
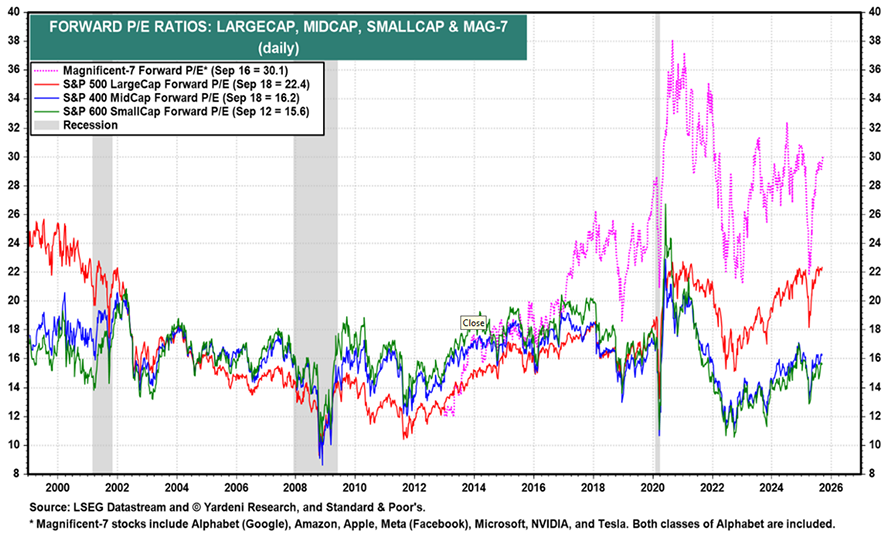
Just as selling high flying tech stocks solely “because they’re expensive” has been a mistake over the past three years, so buying stocks “because they’re cheap” usually results in underperformance. Valuation without a catalyst is a value trap. But small caps now enjoy a macro catalyst: deregulation and M&A activity create tailwinds for smaller companies, and this is beginning to happen (note the series of bank mergers in recent days). Moreover, interest rate cuts help small caps more than large caps, because they tend to fund their businesses with floating rate debt. As a result, momentum in small caps has improved and they are trading at all-time highs for the first time since 2021 (again, not a reason to sell).
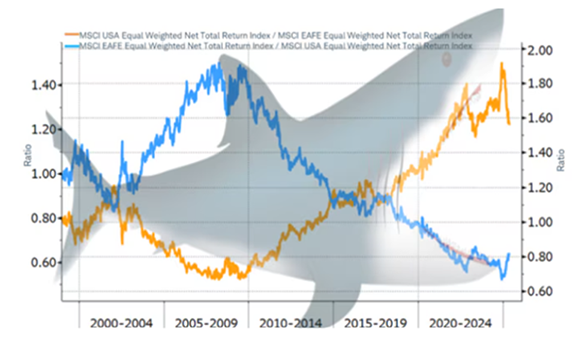
On the international front, we wrote in our last Outlook and earlier in this one about the substantial macro tailwinds for developed international stocks, following nearly two decades of underperformance. We discussed the structural shifts and macro tailwinds in Europe in that Outlook. Japan is now seeing a similar “run it hot” policy mix as the US and Europe, while stock valuations there remain undemanding, corporate governance is improving, and stock indices (finally) broke above their 1991 all-time highs in recent weeks. We expect the jaws in the graphic below to continue to close in the coming years.
Always Own Beta (but not just Equity Beta)
One of our favorite financial commentators recently wrote a piece titled “Always Own Beta.” The crux of his argument was very simple: always own assets (stocks, bonds, commodities, real estate) because they will outperform cash over time. Timing the market and generating alpha is hard. If you try to nimbly exit the stock market at opportune times (e.g. just before the supposed bubble bursts) and re-engage when better values appear, you will likely fail. But this doesn’t mean you should just own stocks (equity beta) or that you shouldn’t tilt your portfolio towards where there is greater relative value. How you construct your beta portfolio (what stocks you pick) matters. Which assets you hold matter.
BONDS – We wrote at length in our last Outlook on the value of diversifying assets outside of equities. Mike Arnold, our Manager of Fixed Income, has written an insightful piece outlining the current opportunities in bonds markets, as a companion to this Outlook, which I encourage clients to read.
COMMODITIES – In 2022, stocks and bonds declined precipitously together, because inflation was a problem. While we don’t foresee inflation returning to 2021-22 levels any time soon, inflation remains sticky. Money supply growth has ticked up to nearly 5%. The lower dollar, while it has boosted segments of the economy and aided international stock performance, should mechanically support inflation.
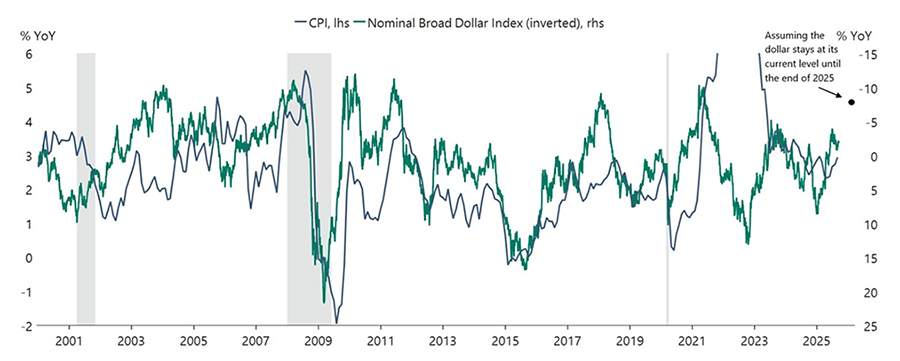
Now, as in 2022, allocation to a diversified portfolio of commodities remains one of the best and most time-tested ways for investors to protect against inflation. We have been adding commodities exposure to portfolios.
ALTERNATIVES – Back in April, we wrote about a hedged credit strategy we have been utilizing as an alternative to high yield bonds that offers similar returns with less downside risk. This fund has outperformed since, but we still think the relative investment case for it makes sense over high yield, and we continue to utilize it in client portfolios. Importantly, we view this strategy as just one of multiple tools in the toolkit to improve the risk-adjusted performance of portfolios. Uncorrelated absolute return strategies (“hedge funds”), private credit, and real estate are other examples that can make sense for clients.
CASH – Cash represents a call option on assets without an expiration date. Yes, as we noted earlier, assets outperform cash over time. But portfolios with ZERO cash (or short-term bonds) have no dry powder to deploy when opportunities present themselves (and are also impractical for most real-life situations).
Conclusion: 4Q25 Outlook
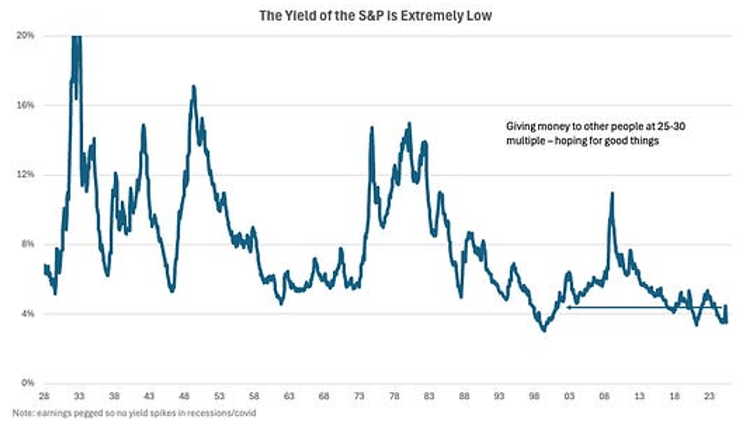
The US stock market may or may not be in a “bubble.” As we’ve discussed, whether we are or we aren’t isn’t very helpful information in terms of how to position client portfolios today. But US large cap valuations are certainly not super-cheap, with earnings yields about as low as they have ever been.
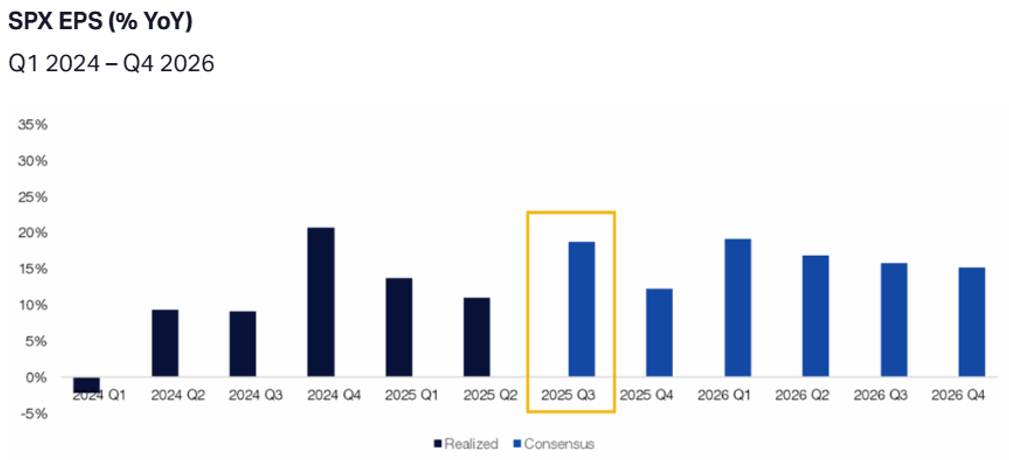
At the same time, whereas the “bar” for 2Q earnings was relatively low, analyst estimates are baking in nearly 20% year-on-year growth for the 3Q earnings season kicking off this week, a tougher hurdle to clear.
So, this creates some near-term risks in our view, which is all the more reason to maintain balanced portfolios that allow for tactical rebalancing to take advantage of volatility. As another investor succinctly put it in a recent letter to clients: the “24/7 AI bubble and dot-com comparisons are getting tiresome. Focus on what matters and what’s in our control.” At Stock Yards Bank, this means maintaining sensible exposure to the highest quality growth companies (which means owning some “AI stocks” in a thoughtful way), trimming exposure when valuations get too frothy (see: recent reduction of Oracle (ORCL), previously our largest active overweight equity position), and building balanced portfolios: stocks (international and domestic, small and large), bonds, commodities, alternatives, and some cash to take advantage of volatility.
We hope you are having a pleasant start to Fall and back-to-school season. Please call me or anyone else on the SYB Investment Team if you have questions or we can be of assistance.
We provide the information in this newsletter for general guidance only. It does not constitute the provision of legal advice, tax advice, accounting services, investment advice, or professional consulting of any kind. The information provided herein should not be used as a substitute for consultation with professional tax, accounting, investment, legal, or other competent advisers. Before making any decision or taking any action, you should consult a professional adviser who has been provided with all pertinent facts relevant to your particular situation. The information is provided “as is,” with no assurance or guarantee of completeness, accuracy, or timeliness of the information, and without warranty of any kind, expressed or implied, including but not limited to warranties of performance, merchantability, and fitness for a particular purpose.