


Market Outlook Q3 2024: Bad Goldilocks?
Wed, 07/24/2024 - 09:57 Wealth management

(502) 259-2543 | John.Fidler@syb.com
Q2 Review
The U.S. economy has shown surprising resilience after 18 months of rapid rate interest rate hikes followed by a year of steady—“higher for longer”—Federal Reserve decisions.
The artificial intelligence (AI) boom, decent corporate earnings growth, continued deficit spending, and accommodative financial conditions have driven a sustained stock market rally, though one typified by ever-narrower market leadership. By mid-July, AI semiconductor leader Nvidia (NVDA) accounted for 35% of the S&P 500’s 2024 gains.
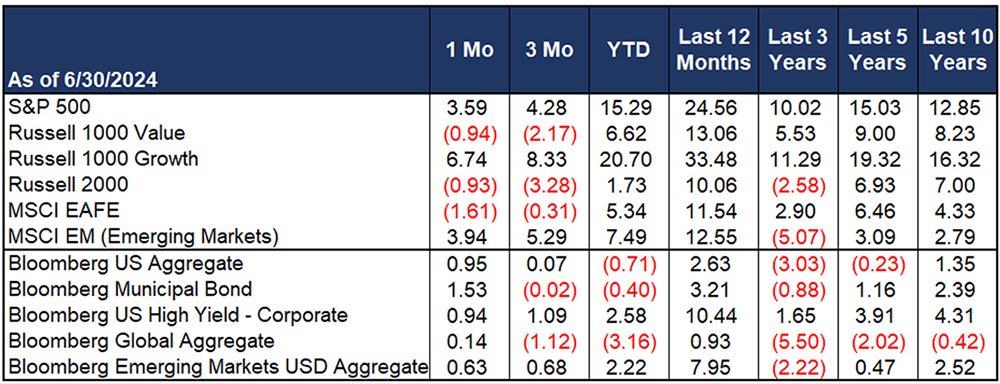
Thankfully for consumers, a disinflationary trend remains in place, but its momentum has slowed in recent months. A mix of somewhat encouraging inflation data—retail sales and producer prices recently logged negative year-on-year prints—has apparently convinced the bond market that rate cuts are on the way.
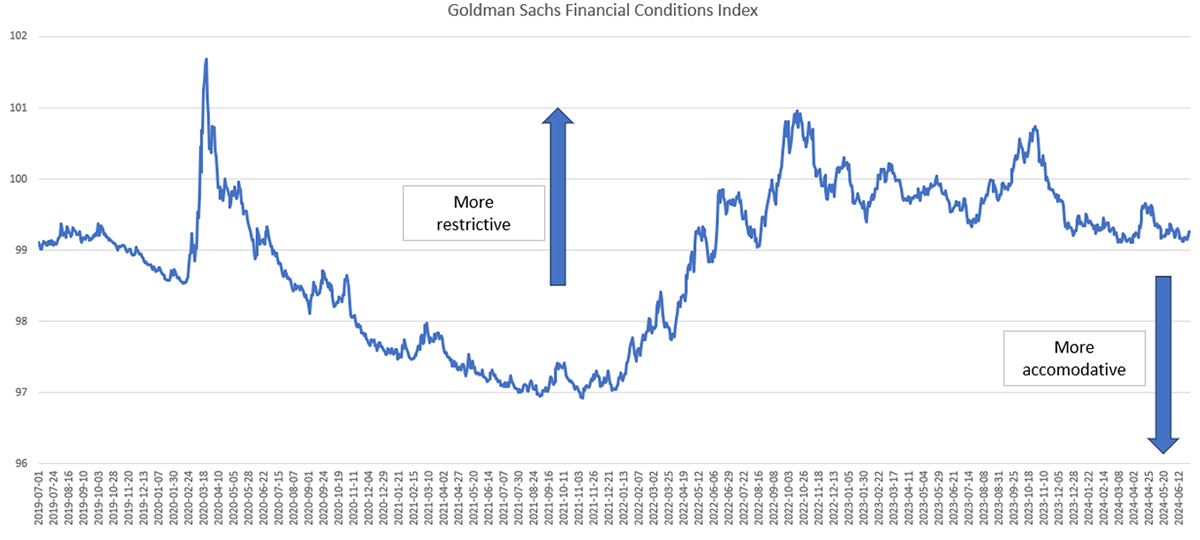
Between lower yields and tighter credit spreads, U.S. financial conditions have steadily become more accommodative during the past nine months, fueling and reinforcing a 25% rally in the S&P 500 since Halloween. Much of this shift was driven by the Treasury choosing to fund the deficit with short-maturity T-bills instead of longer-term bonds.
Fears over the economy and financial system being unable to withstand higher rates after zero or near-zero interest rates for more than a decade arrived with 2023’s spring bank failures. Yet so far, those fears have proven unfounded—or at least premature.
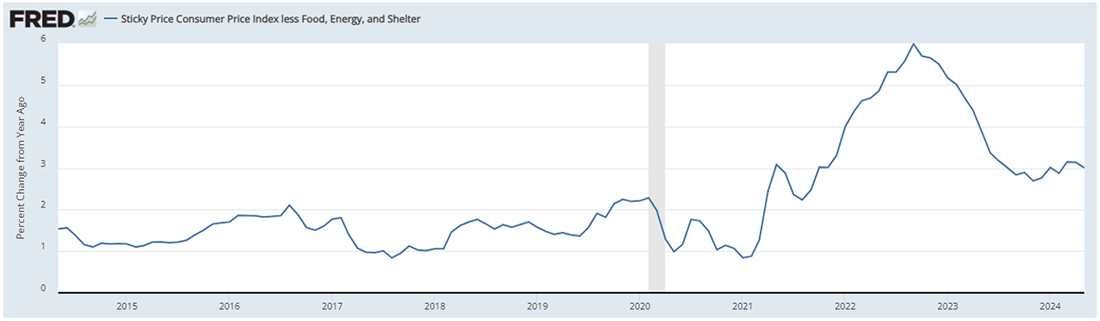
However, in the post-COVID economic paradigm, growth and inflation seem more closely linked than they were during the 2007-09 global financial crisis or right before the pandemic shutdowns. The cost of easy financial conditions during COVID has been sticky inflation well above the Fed’s 2% target as shown in the chart below. More on this later.
Party like it’s 1999

Increasingly, market commentators are expressing concern that the narrow market leadership of the “Magnificent 7” or “Fab 5” tech stocks represent a market bubble that will end in tears. Some investors remain haunted by the late-1990s tech bubble which peaked in March 2000.
Though this boom/bust scenario could prove the case, most bull markets feature startling corrections before they finally break.
At Stock Yards Bank & Trust Wealth Management, we focus our stock picking on quality growth companies that are the primary beneficiaries of long-term secular economic trends. That’s why we believe that we are still in the early- to middle-innings of the AI secular theme. Speaking with industry experts we work closely with, it seems clear that AI is simply the next major platform shift in tech.
Following the tech engine
Each of these platform shifts created leaders that compounded at above-market rates for many years:
- During the 1980s, the personal computing era began—with Microsoft (MSFT) as its poster child.
- By the mid-1990s, the internet moved into the consumer space with the first ecommerce giants, including Amazon (AMZN).
- In the early 2000s, Alphabet (GOOGL) transformed the search engine into a global revenue generator.
- By 2007, Apple’s (AAPL) iPhone took that revolution mobile.
- And in the 2010s, innovations in cloud computing from “hyperscalers” including Google, Amazon, and Microsoft began creating an exponentially more powerful information highway.
Now, AI brings “intelligence” to that superhighway via enormously complex and energy-intensive learning models. So, for now, the hyperscalers remain the winners, as are firms supplying them with “picks and shovels” to keep innovating and growing (NVDA and a few others).
Today’s AI boom is reminiscent of prior platform shifts, but from a performance and valuation perspective, 1999 and 2024 look quite different.
At the 2000 peak, the four leading tech companies traded at a forward price-to-earnings (P/E) multiple of almost 90 times earnings. (The median historic P/E for the S&P 500 stock index is around 18.) Today, the NASDAQ trades a little less than 30 times forward earnings. High-growth software companies trade about 12 times forward sales, versus 28 times at the 2021 peak.
Back to NVDA. The poster child of the AI boom has seen its stock price rise over 30x since 2017, but its earnings have increased by about 28x over the same period (see chart below). NVDA’s forward P/E ratio was over 50x in 2018, versus about 40x today. So, critically, the rally in stocks like NVDA has been supported by a step function higher in earnings, not just by speculative multiple expansion, as was the case in 2000 and 2021.
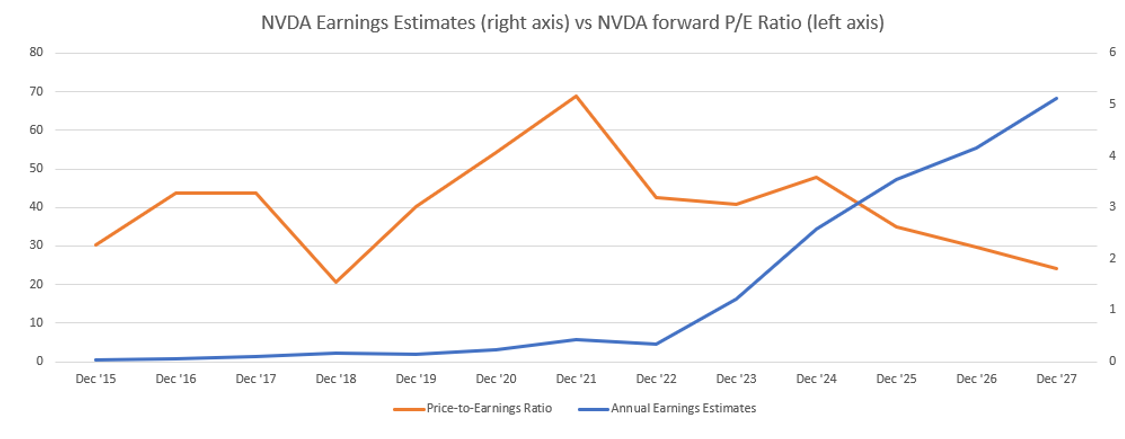
How can this earnings growth continue? Because buying Nvidia chips is a very good business decision for hyperscalers like Amazon and Microsoft. Our internal research indicates that the payback period for companies that run an advanced NVDA AI system is less than two years. This equates to a whopping 70%+ return on invested capital for Nvidia’s customers.
We would much rather own a business like Amazon or Microsoft that can reinvest their cash flows in projects with a 70% profit potential than businesses that return cash to shareholders via dividends. Our list of ideas that can generate a relatively certain 70% profit in 18 months is fairly short, to say the least.
However, entry prices and multiples matter, which is to say we are not likely buyers of more NVDA shares at recent all-time highs. Unlike in 1999 and 2000, when anything with the dot-com label soared (remember Pets.com?), today’s market has been much more discriminating in terms of where returns are concentrated.
This presents an opportunity for alert stock pickers who can differentiate winners from losers and identify pockets of value within the technology sector and the market as a whole.
What’s next for the Fed?
The Fed continues to tread an increasingly narrow, perhaps precarious, path. Premature rate cuts could keep conditions easy and boost asset prices but are likely to lead to a resurgence in inflation, the Fed’s supposed Public Enemy #1.
On the other hand, waiting too long to cut rates, especially as the economy has yet to fully absorb the lagged impact of prior rate hikes, risks a hard landing in 2025.
While the economy remains robust at a high level and financial markets are discounting continued smooth sailing, we are seeing cracks under the hood from the lagged effect of high rates.
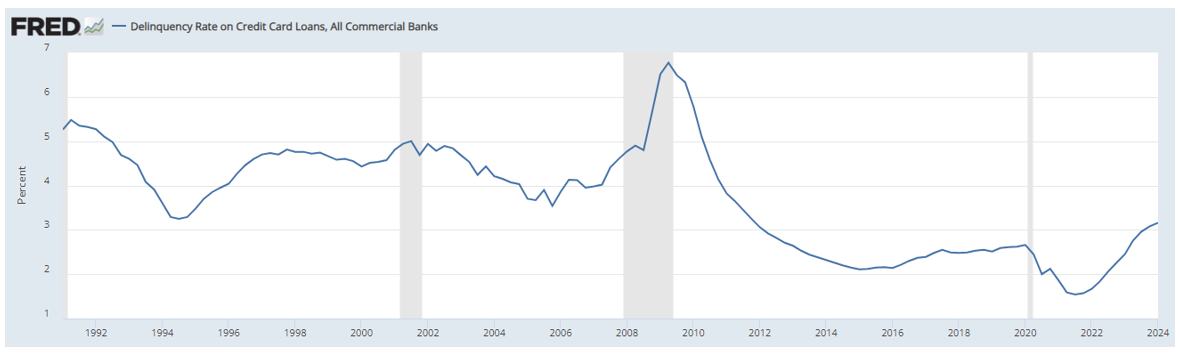
For consumers, it’s a bifurcated situation. The well-off, buoyed by a wealth effect from the assets they own, are still spending. But lower-end consumers are either not spending or are utilizing revolving debt to fund purchases (see chart below), as excess savings from COVID-era stimulus have evaporated and credit card and auto loan delinquencies are on the rise.
This split is always present to some degree, but the current dichotomy seems both extreme and unsustainable.
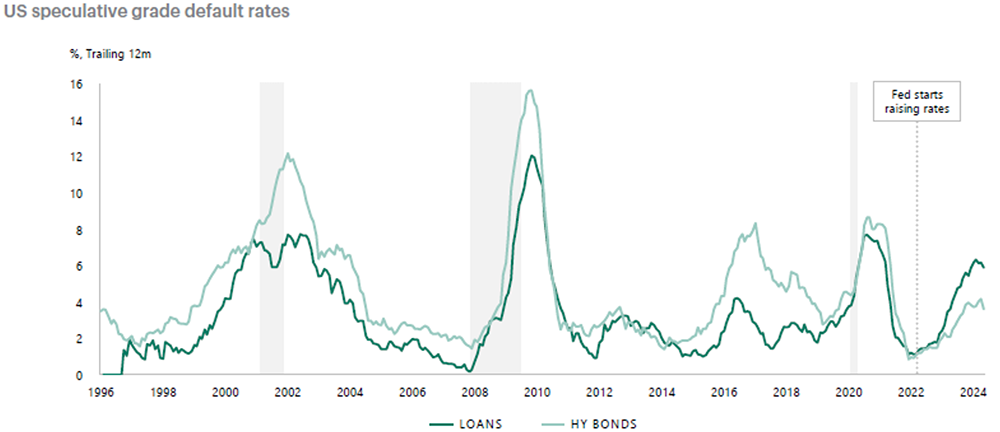
Now, to companies. The most indebted companies find themselves in much the same situation. Highly levered firms are beginning to experience financial distress at increasing rates, as shown by the uptrend in high-yield bond and leveraged loans defaults (below).
That said, the U.S. banking system sports stronger balance sheets and much less systemic risk than in the mid-2000s, before the global financial crisis. However, higher interest rates and an inverted yield curve—as well as credit quality pressures in commercial real estate—are a fundamental headwind for the financial sector.
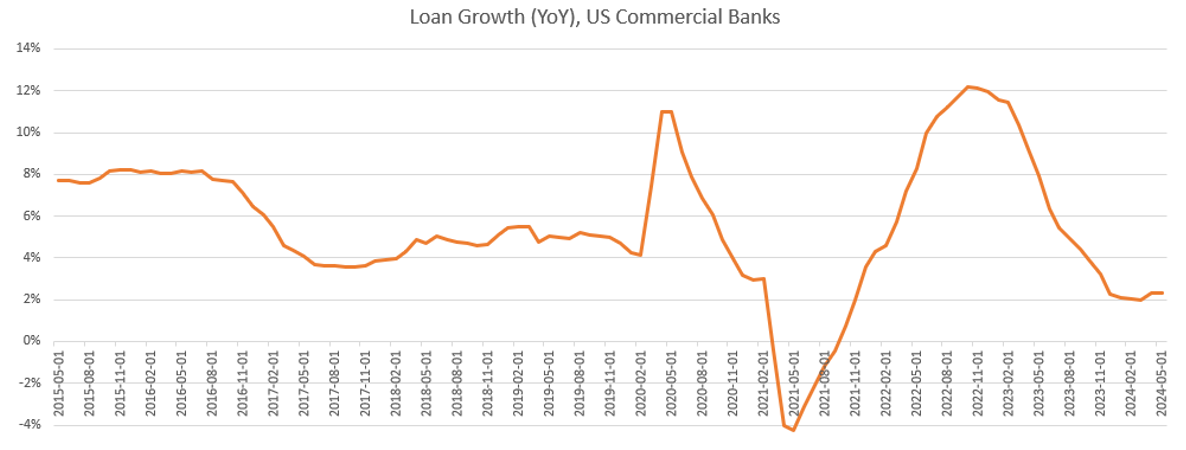
For every $1 of deposits, a bank can make up to $10 in loans. From that perspective, it’s really the commercial banking system that creates money, not the Fed. This is how our fractional reserve banking system works. But, given compressed margins and credit worries, bank lending growth remains tepid.
These weak spots alone are unlikely to justify an imminent Fed interest rate cut. By just talking about cutting rates and signaling so insistently that the next move will be a cut, the Fed has loosened financial conditions. It’s what Economist Torsten Sløk referred to in May as the “Fed Cut Reflexivity Paradox,” where the Fed’s jawboning about lowering rates has made it more difficult for the central bank to lower rates.
Real economic growth is currently around 3%, though likely slowing to 1.5%-2% for the rest of 2024. Core inflation is around 3%, and unemployment is at 4%. Each of these data points sit at levels associated with prior booms and periods of rising rates.
Monetary policy rules of thumb like the Taylor Rule imply that rates should be higher than they are currently. Financial conditions have become more accommodative than any time in the past two years. Normally, when inflation spikes, the Fed swiftly hikes rates. Conversely, the Fed tends to react quickly and cut rates when growth suddenly deteriorates, and unemployment rises. But the current set of data points just aren’t consistent with an urgent need to cut interest rates.
As we wrote last quarter:
The only way to purge inflation from the system is to tighten financial conditions and that can’t happen without credit spreads widening (i.e. borrowing costs for riskier or lower-quality credits rising relative to those for good credits) and equities selling off. As interest rate volatility is digested by equity markets, one would expect a buyable market correction in the quality growth stocks we favor. To the extent inflation continues to run hot, it should benefit the energy, emerging market, and non-correlated alternatives allocations within portfolios.
1A formula developed by Stanford economist John Taylor that ties a central bank’s benchmark interest rate to inflation and economic growth
These comments remain relevant. Not that much has changed in the past three months. We saw a touch of “interest rate volatility” in late March and early April as the 10-year Treasury yield pushed up to nearly 5% and the Nasdaq corrected about 7% from the March highs. These modest corrections proved short-lived.
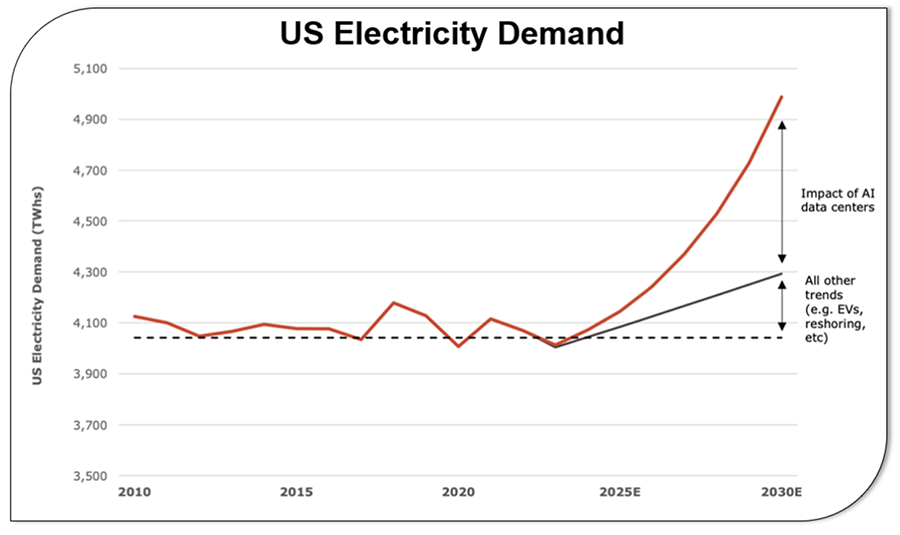
The Fed also must consider structural reasons that remain for higher inflation and higher for longer rates, at least relative to the extremely low levels we saw after the financial crisis up until COVID. Inflation contributors include de-globalization (and re-militarization), a staggering fiscal deficit, and a costly energy transition – to say nothing of the massive electricity demand (see below) required by AI. AI may prove deflationary in terms of improving service sector productivity, but it will definitely create inflation on the commodity side of the ledger.
Elsewhere in Washington
Additionally, with the upcoming U.S. election and former President Donald Trump’s rising polling numbers after President Joe Biden’s disastrous performance in their first debate and his subsequent exit from the race, it’s worth noting that Trump’s proposed policies, both on trade (higher tariffs) and immigration (more restrictive) are squarely inflationary, whatever one thinks of their merits otherwise.
Moreover, the Biden/Harris administration has done little to relax the existing Trump tariffs and neither candidate seems likely to reduce deficit spending in a major way, which has the potential to push bond yields higher. Last fall, we wrote about the potential return of the “bond vigilantes” of the 1990s. With 10-year yields around 4.3%, these fears seem far away. But with about $2.2 trillion additional Treasury bond issuance scheduled for 2024, a bond buyers’ strike could re-emerge suddenly.
Just right? Or all wrong?
We mentioned something about Goldilocks.
If you’ve made it this far, you’re no doubt wondering what the title of this Outlook meant for our current investment strategy.
As a reminder, a “Goldilocks economy” is commonly used to describe a “just right” economic environment where growth is steady (no recession), but not so strong that inflation rises by too much (meaning no rate hikes).
Those declaring Fed victory based on recent cooler inflation prints and still-strong growth would likely say we’re in Goldilocks territory today.
Yet while the current backdrop may be “just right” for the economy, remember that the economy is not the stock market.
For asset prices, we would call this a “Bad Goldilocks” situation. Growth is decelerating, but not to recession levels, at least not in the next couple of quarters. Also, economic growth is likely to fall short of the bullish expectations priced into equities, but the overall economy may prove too strong to justify the recession fears and easing cycle expectations now priced into bonds.
So, here’s where the “bad” comes in.
We think that while fixed income will continue to provide good all-in yields, there will be volatility. So, beware of extending duration at near-term interest rate lows such as we likely find ourselves at present. Additionally, meaningful interest rate volatility is likely to cascade into the stock market as it did throughout 2022, in late summer 2023, and briefly during April this year.
Idiosyncratic values exist in stocks, but the risk/reward tradeoff for indiscriminate index fund buyers is getting increasingly poor.
A re-rating of equities on modestly slowing growth would likely prove a buying opportunity, but we are not adding meaningfully to stock allocations at these levels. If this year’s easy financial conditions result in a resurgence in inflation, asset classes like energy, real assets, and non-correlated alternatives will prove valuable.
In the second half of the year the Fed and investors will have to navigate the deflationary impulse of past rate hikes and the inflationary impulse of their own “pivot” towards more dovish policy. Cut rates too soon, or with the U.Ss economy still strong, and the Fed risks a return of inflation or a speculative run-up in asset prices.
Wait too long, and they risk a 2025 recession.
Our tactical asset allocation shifts for the rest of 2024 will be dictated not just by valuations, economic data or by what the Fed does, but also by why the Fed is doing what they’re doing. Chairman Powell seems determined to cut rates this year. Typically, Fed rate cuts are not “mid-cycle adjustments” but rather a response to clearly slowing economic data which signal a coming recession.
Thus, if rate cuts are a response to slowing growth and sharply falling inflation, we would view it as a signal to get more defensive. However, if we see rate cuts despite a strong economy, whether driven by overseas issues, moderating inflation without a growth slowdown, or simply because the Fed feels they need to maintain credibility, it could trigger a substantial equity market rally. We believe (perhaps naively) that markets will be able to discern the difference.
There is precedent for rate cuts in the face of a strong economy. In 1998, the Greenspan Fed cut rates despite high nominal GDP growth in response to a broadening emerging markets crisis that threatened to spill over to developed markets. The NASDAQ proceeded to double over two years before crashing in 2000.
In 1927, the Fed also cut rates despite a booming economy, again to alleviate stress overseas and stabilize the currencies (and gold reserves) of our European allies. Again, U.S. stocks doubled in about 18 months, before crashing.
We are predicting neither a 100% stock market run-up nor a crash. But today’s international situation bears more than a passing resemblance to these prior scenarios. Concerns include a slowing Europe wracked by electoral dysfunction, the plummeting Japanese yen (now trading at a 40-year low versus the U.S. dollar), or a moribund Chinese economy still working its way through a property bubble.
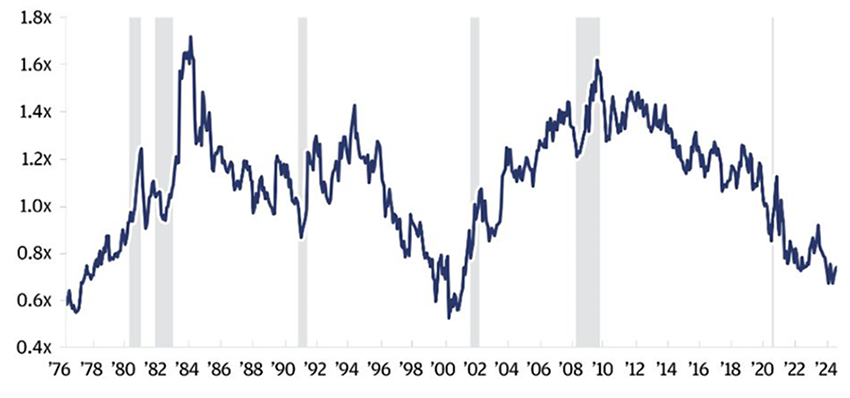
If this were to play out again, “hot” sectors like semiconductors and unloved cyclical asset classes like small cap equities would likely see substantial appreciation. The potential for this is particularly intriguing when one looks at the relative value in U.S. small cap stocks (see chart below).
In closing, we found tennis legend Roger Federer’s recent commencement speech at Dartmouth University enlightening. (I’m sure those of you who are tennis fans did.) His key point was, “In tennis [as in life and investing], perfection is impossible.”
Federer played 1,526 singles matches in his career and won almost 80% of them. But he only won 54% of the points in those matches. Thus, the difference between the greatest tennis player of all time and someone you’ve never heard of is, statically speaking, the difference between winning and losing just a tiny percentage of points.
Very tiny statistical edges on a single point in a tennis match or a single day, week, or month in the markets can translate to enormous success over the long run.
In this way, the difference between investing and gambling is similar to the difference between Roger Federer and that someone you’ve never heard of. Prudent investors have a positive expected return over time, but their performance over a short period of time may be indistinguishable from the lucky, foolish gambler.
As we see traders chasing speculative manias like cryptocurrencies and dubious companies tangentially related to AI, it’s an important lesson to keep in mind.
We provide the information in this newsletter for general guidance only. It does not constitute the provision of legal advice, tax advice, accounting services, investment advice, or professional consulting of any kind. The information provided herein should not be used as a substitute for consultation with professional tax, accounting, investment, legal, or other competent advisers. Before making any decision or taking any action, you should consult a professional adviser who has been provided with all pertinent facts relevant to your particular situation. The information is provided “as is,” with no assurance or guarantee of completeness, accuracy, or timeliness of the information, and without warranty of any kind, expressed or implied, including but not limited to warranties of performance, merchantability, and fitness for a particular purpose.
Investment and Insurance Products are:
Not Bank Guaranteed | Not a Deposit | May Lose Value
Not FDIC Insured | Not Insured By Any Federal Government Agency